





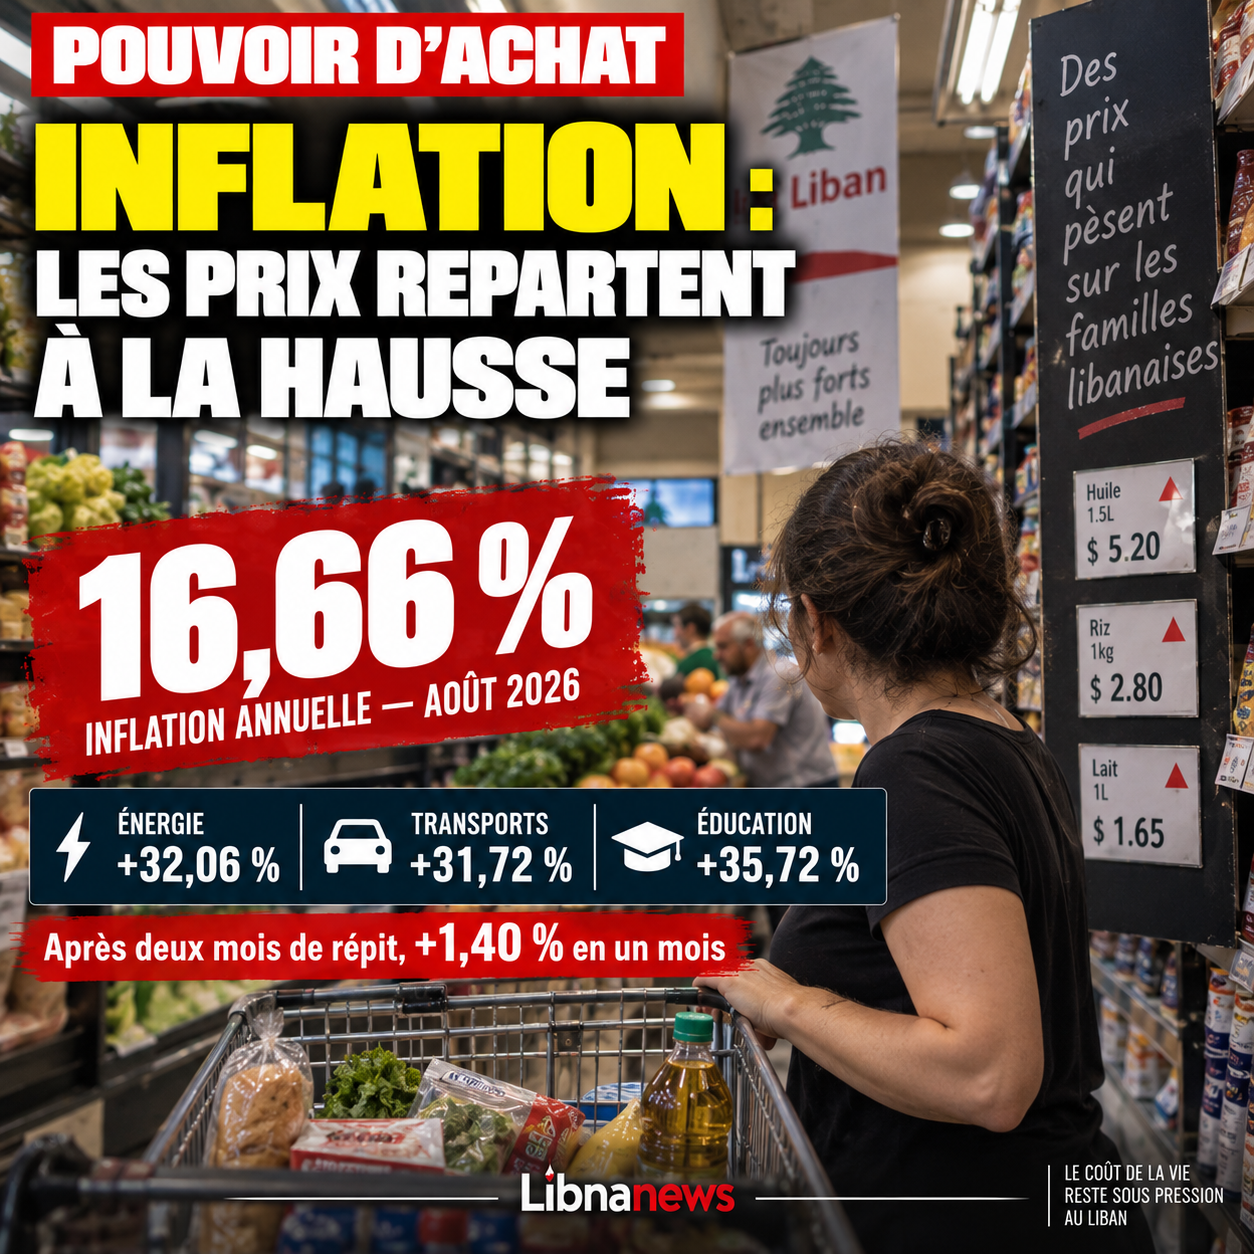
Inflation in Lebanon reached16.66 % over one year in august 2026, compared with 15.69 per cent in July, according to the latest data from the Central Statistical Office (CAS). At the same time, the consumer price index rose by1.40% in one month, ending the slight decline observed in July. Energy, transport, education and leisure are among the highest annual increases. Official data also show significant geographical differences, with a particularly strong monthly increase in Nabatiyeh.
Inflation in Lebanon reached 16.66 per cent
The rise in consumer prices accelerated in August. According to the official figures published on 21 September 2026 by the CAS, the price index increased by16.66 % compared to august 2025.
The annual rate was 15.69 per cent in July. It reached 17.25 per cent in June, 19.04 per cent in May and 20.02 per cent in April.
This trend shows that inflation remains high, although its annual rate remains below the levels recorded in the spring.
Over a month, the movement is clearer. Prices rose by1.40% between july and august, after a decrease of 0.03% in july and a decrease of 0.75% in june.
The general consumer price index thus reached8 816.35 points in august 2026against 7,557.53 points a year earlier.
In the first eight months of 2026, average annual inflation was around 16.2%, according to available economic data.
The August upturn occurred in an economy where a large part of the prices were now directly or indirectly linked to the dollar. The relative stability of the pound’s exchange rate since 2023 had contributed to a sharp slowdown in inflation following the surges in the early years of the crisis.
However, the security situation and the evolution of energy prices continue to exert pressure on several components of the household basket.
Energy and transport
Detailed data show that increases are not consistent.
The postwater, electricity, gas and other fuels, which represents 11.8% of the basket used to calculate the index, increased by32.06 % year-on-year.
The increase also reached7.15% over august alone. This item is therefore one of the main sources of immediate pressure on household spending.
Transport, which accounts for 13.1% of the index, recorded an annual increase of31.72 %. The evolution of fuels and more broadly of energy products contributes to this increase.
Food is also on the rise. Prices of food and non-alcoholic beverages, which account for 20% of the index, increased by11.65 % year-on-year.
The housing occupied by its owner, whose weight is 13.6%, shows a more limited annual increase of7.08 %.
Major annual increases in August 2026
| Consumer item | Weight in CPI | Annual change |
|---|---|---|
| Leisure, entertainment and culture | 2.4 % | +45,69 % |
| Education | 6.6 % | +35,72 % |
| Old rents | 0.36% | +32.33 % |
| Water, electricity, gas and fuels | 11.8% | +32.06 % |
| Transport | 13.1% | +31,72 % |
| Restaurants and hotels | 2.8% | +14.26 % |
| Food and non-alcoholic beverages | 20,0 % | +11,65 % |
| Health | 7.7% | +7.42 % |
| Owner-occupied housing | 13.6% | +7.08% |
| Clothing and footwear | 5.2 per cent | +1.15 % |
These figures show that some of the largest increases relate to items whose weight in the statistical budget remains limited. Therefore, the overall rate of 16.66 per cent is not fully affected by the increase.
Education increased by 35.72 %
Education stands out with an annual increase of35.72 %. It represents 6.6% of the basket of the price index.
This increase is taking place in the run-up to school and university, during which time educational expenditure is placed on the budget of many families.
However, leisure, entertainment and cultural activities show the largest annual increase among the major categories cited:45.69 %. Their weight in the index remains much lower, at 2.4%.
Old rents increased by32.33 % year-on-year, but only 0.36% of the basket.
Restaurants and hotels recorded an increase of 14.26%. Health spending increased by 7.42%, while clothing and footwear increased by only 1.15%.
A category differs in the opposite direction. Communications prices, which account for 4.5% of the basket, decreased by0.78% year-on-year. This is the only major component with an annual decline in August among the detailed data available.
Nabatiyeh recorded the largest monthly increase
The CAS also publishes monthly price trends per governorate. All areas covered increased in August.
| Government | Monthly change in August |
|---|---|
| Nabatiyah | +2.12% |
| Bekaa | +1.38% |
| Northern Lebanon | +1,09 % |
| South Lebanon | +0.79% |
| Mount Lebanon | +0.75 % |
| Beirut | +0.50 % |
Nabatiyeh showed the strongest increase, with 2.12% in one month, compared with only 0.50% in Beirut.
However, this data should be interpreted with particular caution for Nabatiyeh.
The CAS indicates that the current situation continues to hamper price collection in that governorate. Much of the price actually charged could not be raised. The statistical administration therefore had to use a large number of imputed prices to calculate the index.
This methodological precision is important. It means that the figure published for Nabatiyeh remains the official estimate, but that it is based more on statistical methods to compensate for the absence of direct observations than in other regions.
A monthly recovery after two months of respite
The evolution of recent months makes it possible to better measure the movement observed in August.
In April, annual inflation was still 20.02%. It rose to 19.04 per cent in May and to 17.25 per cent in June. It then declined to 15.69 per cent in July before returning to16.66 % in august.
The monthly movement has also changed direction. After a decrease of 0.75% in June and 0.03% in July, the index started up by 1.40% in August.
This recovery does not mean that all prices are increasing at the same rate. It results from very different movements according to the categories of consumption.
Energy is one of the main short-term pressure points. The monthly increase of 7.15% of the item comprising water, electricity, gas and fuel comes in, while this category represents almost 12% of the reference basket.
At the same time, transport shows an annual increase of more than 30%. For households, these two categories can also have indirect effects, since energy and transport costs are involved in the operation of many enterprises.
A purchasing power always under pressure
The considerable slowdown in inflation compared to the most acute years of the Lebanese crisis does not mean a return of prices to their previous levels.
An annual rate of 16.66% indicates that the basket measured by the CAS is significantly more expensive than a year ago. This is an additional variation applied to price levels which had already risen sharply in previous years.
The situation is particularly sensitive when the increases relate to expenditure that is difficult to reduce. Food increases by 11.65 %, while energy and transport increase by more than 30 % over one year.
However, the price index is a national average constructed from a weighted basket. It is therefore not exactly the increase in the cost of living experienced by each household. It depends on the structure of its expenditure, housing, travel, school fees and energy consumption.
Future CAS publications will determine whether the August upturn is a one-time move after the monthly declines in June and July, or the beginning of a new phase of price acceleration.