

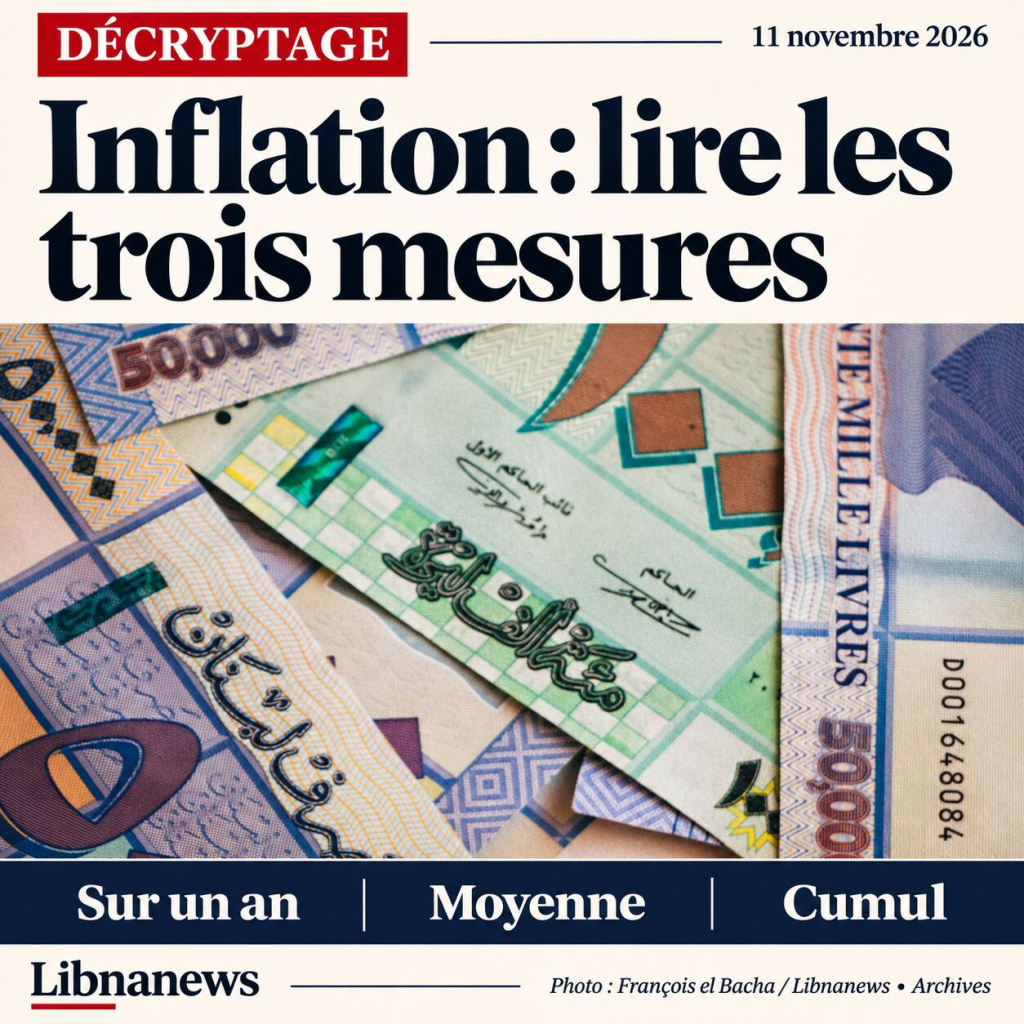
Inflation in Lebanon is not just a percentage. A 12-month change, an annual average and a cumulative increase answer three different questions. Confounding them changes the diagnosis of prices and purchasing power. The figures from the Central Statistical Office allow us to understand these differences, provided we keep their dates.
In September 2026, the consumer price index increased by 17.53% year-on-year and by 1.35% month-on-month. These two results appear on the scoreboard of the Central Statistical Office (CAS). The first compares September 2026 to September 2025. The second compares September to August 2026. Neither of them alone gives average inflation for the whole year 2026.
This distinction becomes essential when a similar monthly figure with an annual economic forecast. An annual average forecast covers 12 months, some of which are not yet observed. An annual slide describes two dates already known. Their digital proximity does not mean that they measure the same thing.
Inflation in Lebanon: always ask « in relation to when? »
The year-over-year index is the same as the previous year. It answers a specific question: how much have the prices of the statistical basket increased in twelve months? The CAS presents this measure as the official rate of inflation in its note « Inflation in figures ».
The December 2025 table provides a complete example. The general index reached 7,924.3, compared with 7,061.1 in December 2024. The ratio between these two levels, reduced by one, gives about 12.2%. This result describes December versus December. It should not be renamed « average price increase in 2025 ».
The monthly comparison uses the same logic, but with the previous month. The 1.35% of September 2026 thus describes the most recent movement in the series. They are neither a forecast for October nor a guaranteed pace for 12 months. Multiplying this rate by twelve would produce extrapolation, not observation.
| Measure | Comparative periods | Example observed |
|---|---|---|
| Monthly change | One month and the previous | September 2026: +1.35% |
| Annual growth | One month and the same month a year earlier | September 2026: +17.53% |
| December on December | Year end and end of previous year | December 2025: +12.2% |
| Cumulative increase | Two dates explicitly chosen | December 2018 to October 2021: +562 % |
The last example is historical. It comes from a CAS document that was arrested in October 2021. It does not describe the November 2026 prices.
The annual average is 12 months
To calculate inflation on an annual average, it is necessary first to establish the average of the twelve monthly indices for a year. This average is then compared to the 12 months of the previous year. The result takes into account the price path throughout the year.
This method explains why the annual average and the December slide can diverge without contradiction. If a significant increase occurs early in the year, it weighs on many months of the average. If it arrives in December, its effect on the year average is much more limited. The December slide, however, recorded immediately.
It is also necessary to avoid a shortcut: to average the twelve monthly annual rates is not, in general, the same calculation. Their basis of comparison varies from month to month. The average annual measurement is based on index levels and then their ratio.
In an economy that has experienced strong price changes, this difference has nothing to do with it. A year can start with prices already much higher than the average of the previous year. Although monthly increases then slow down, the annual average retains part of this legacy.
Cumulation keeps track of old increases
The cumulation answers another question: how much has the price level changed since a starting date? The CAS illustrates this calculation with an increase of 562% between December 2018 and October 2021. An increase of 562% means that the final level is 6.62 times the initial level. It doesn’t mean it’s 5.62 times that level.
Changing the starting point changes the result. The same document shows 519% between December 2019 and October 2021. These figures do not contrast: they do not cover the same duration. It would be misleading to juxtapose them without specifying their boundaries.
The successive rates are composed. They do not simply add up, as each variation relates to an already modified level. To calculate reliable cumulation, the reader must use indices comparable to both dates. A series of rounded percentages may introduce additional variances.
The cumulation describes a statistical basket. It does not mean that every food, rent and service has experienced the same increase. Food and non-alcoholic beverages showed an increase of 2,067% in the CAS historical example between December 2018 and October 2021. The difference with the general index shows the importance of the job.
Lower inflation leaves prices higher
Disinflation refers to a slowdown in price increases. As long as the rate remains positive, the overall level continues to rise. A fall in inflation does not automatically reduce prices to their previous level. To see a decline in the overall level, a negative change is required over the period.
The purchasing power depends on the comparison between income and prices. An inflation rate is not enough to determine what an employee can buy. It is necessary to know the evolution of his remuneration, his currency of payment and the composition of his expenses. A household that is highly exposed to housing does not experience exactly the same variation as another.
For the next Lebanese survey, four informations will allow a correct reading: the month observed, the monthly variation, the annual shift and the items concerned. The annual average of 2026 will require indices from January to December. Pending these twelve observations, an annual projection must remain clearly presented as such.





Comments