

Lebanese exports almost recovered in dollars in the first nine months of 2025. However, their net weight decreased by a quarter. This contrast, based on the data from Customs, which was stopped in September 2026, poses a decisive question for the recovery: does Lebanon sell more competitive products to more diversified customers, or is it mainly dependent on a few high-value goods and a few outlets?
Saudi Arabia’s return to accessible markets, announced in June, and European trade preferences open up opportunities. However, transforming them into sustainable sales requires production capacity, demonstrable origin, compliant products and secure payments. This FocusLebanon file reviews these mechanisms and the figures available as of 11 November 2026. It covers goods exported, not the price of goods imported into the store or tourism revenues.
Three levels of evidence remain separate: customs trade, access rights opened by agreements and the results of specific channels. An advertisement does not replace a shipment; an export invoice alone does not measure the added value created in the country.
Exports almost stable in dollars, but much lighter
Lebanese merchandise exports reached $2.637 billion between January and September 2026, compared to $2.713 billion in the same period of 2025, according to the Customs Bulletin for the first nine months of the year. The reported decrease is 2.8%. This result does not describe a general collapse or recovery already achieved. It summarizes nine very uneven months, after which two strong summer performances offset part of the decline at the beginning of the year. The document, prepared on 22 October and announced on the customs website on 3 November, makes it possible to distinguish this recent evolution from the composition of sales abroad.Source: Lebanese Customs Bulletin, September 30, 2026, page 1.
A second measure significantly changes the reading. The customs special export trade indicator shows a cumulative net weight of 1,073,131 tonnes in 2026. The total of nine corresponding months of 2025 is 1,438,353 tons in the data displayed. The calculated decrease is therefore about 25.4 per cent, much greater than the decrease in income expressed in dollars. The two findings must be presented together: the country retains much of its export value, but the goods crossing the border represent a much smaller mass.Source: official net weight indicator, thousands of kilograms.
This discrepancy alone does not lead to an improvement in sales prices, margins or product quality. One ton of precious metal and one ton of agricultural products do not have the same value. The ratio between dollars and tons can increase when the composition of shipments changes, without the same product selling more expensive. Total weight is also not an economic volume index with constant composition. It provides information on the mass declared, while the value aggregates goods of a very different nature.
Two months significantly reduced the backlog
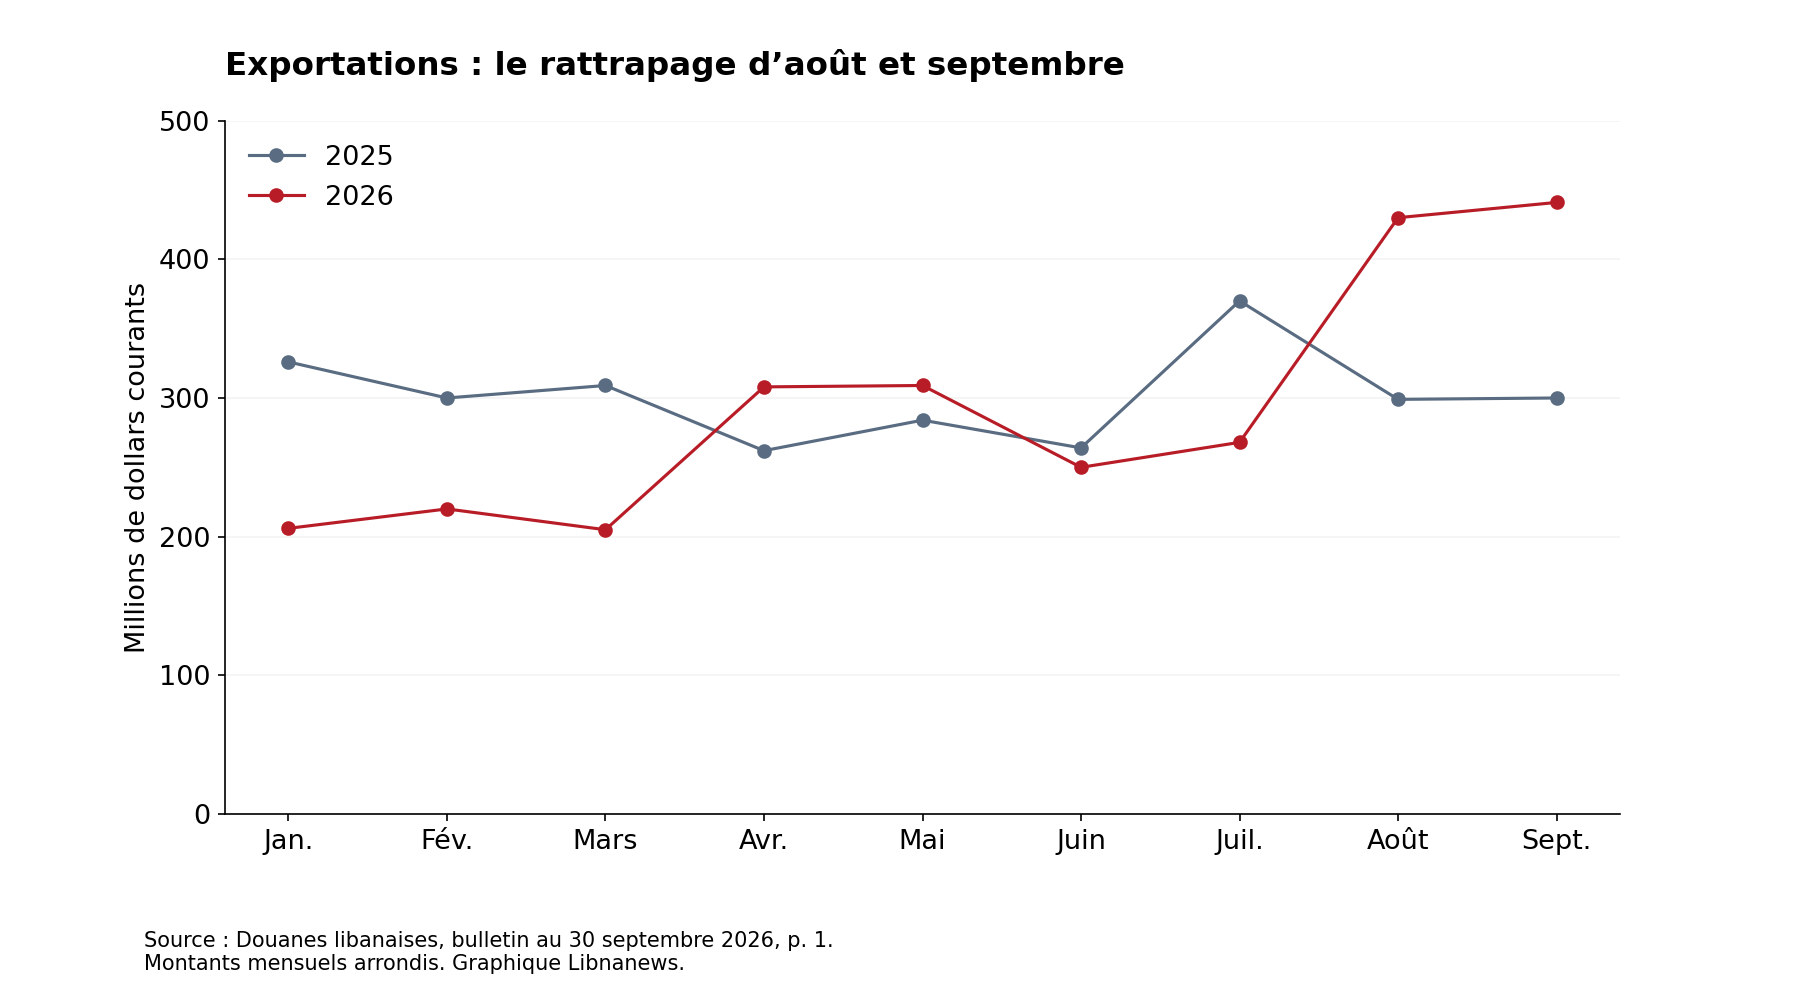
The monthly series shows a deterioration of the first quarter: $206 million in January, $220 million in February and $205 million in March, compared with 326, 300 and 309 million respectively a year earlier. Customs reported decreases of 37%, 27% and 34%. The amounts rounded give a quarterly total of $631 million, compared with $935 million in 2025. This beginning of the year still weighs on the cumulation of September despite the subsequent improvements.Source: Customs Bulletin, page 1.
April and May temporarily reverse the trend, with 308 and 309 million dollars, against 262 and 284 million a year earlier. June amounts to 250 million, against 264 million, then July to 268 million, against 370 million. At the end of July, the seven published monthly values total $1.766 billion, compared to $2.115 billion for the same months of 2025. These additions are calculated on the basis of figures rounded to the million and do not replace the cumulations established by Customs on their detailed data.
The most marked change occurred in August and September. Exports reached $430 million in August, followed by $441 million in September, up from $299 million and $300 million in 2025. The published changes are 44% and 47%. These two months together represent 871 million, or about one third of the total of 2026. Their weight in the result of the first nine months calls for caution: recent growth is real in the declared values, but it is not enough to prove a lasting improvement in all the sectors.
Net weights confirm that the dollar adjustment is not confused with that of tonnage. In August, the export volume increased from 169,328 tons in 2025 to 136,947 tons in 2026. In September, it increased from 192,766 tonnes to 146,775 tonnes. Revenues can therefore increase sharply as the transported weight declines. To explain this movement, the products, their quantities and their destinations should be crossed month by month, rather than assigning the whole difference to a single factor.
The decline of 2026 puts the rebound of 2025 in perspective
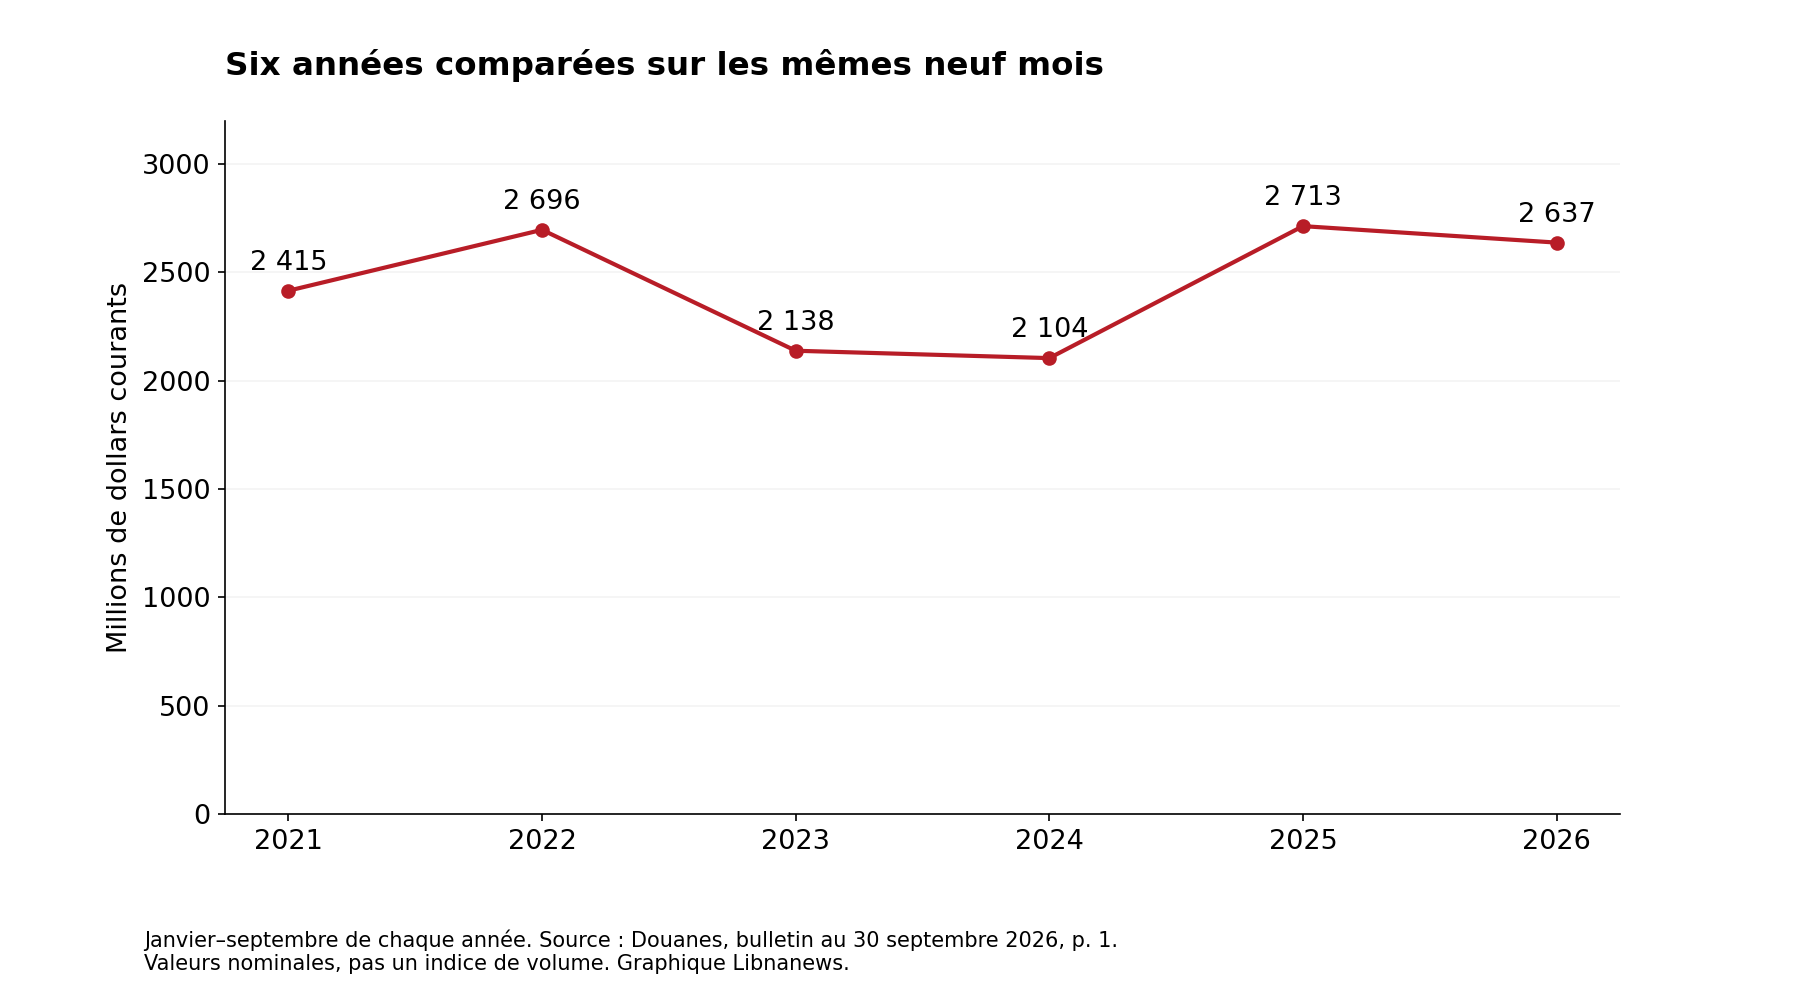
The line in the bulletin on comparable periods allows a homogeneous comparison over six years. Exports from January to September reached $2.415 billion in 2021, $2.696 billion in 2022, $2.138 billion in 2023, $2.104 billion in 2024, $2.713 billion in 2025 and $2.637 billion in 2026. The last result therefore remains higher than the levels of 2023 and 2024, but lower than those of 2022 and 2025. It exceeds by about 9.2 per cent that of 2021, calculated on the amounts published. These values are nominal: this difference does not measure an equivalent increase in the quantities or purchasing power of revenue.
The 2025 rebound had brought exports in the first nine months 28.9% above their 2024 level, according to Customs. The current decline follows this strong increase. But a comparison of dates is not enough to identify the industrial mechanisms behind it. Nor does it demonstrate that all exporting companies have the same path. Aggregate figures may be dominated by a few high-value items, making the examination of products indispensable.
Precious products represent one third of the revenue
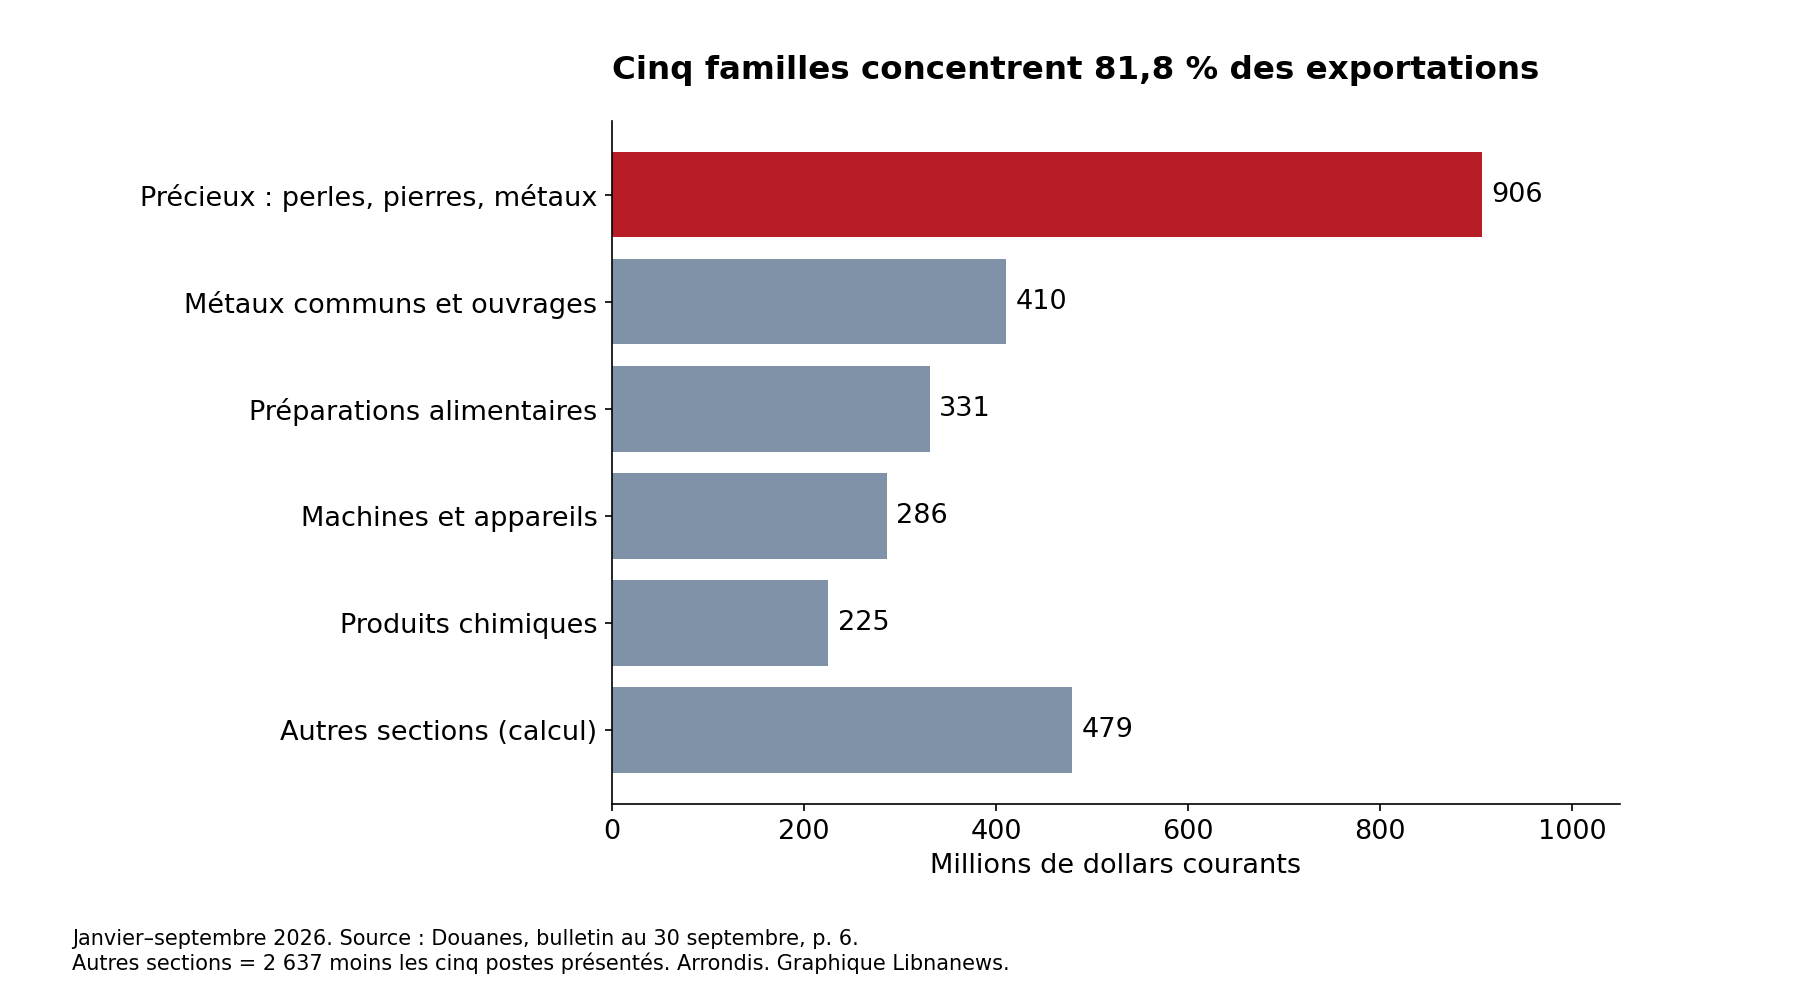
The customs section of pearls, precious or semi-precious stones and precious metals represents $906 million over the first nine months of 2026. Its published share reaches 34% of exports. This is the first set of products in the bulletin, far ahead of base metals and their works, which total 410 million. This weight requires distinguishing the behaviour of precious goods from that of other exports before talking about general health of the productive apparatus.Source: Customs Bulletin, page 6.
However, the wording of this section should not be shortened to « gold » or « jewelry » without further information. The table contains several categories and does not give a detailed breakdown at this level. It also does not distinguish the share of value derived from work in Lebanon from that of materials incorporated into goods. The $906 million is a value exported in the customs sense, not a measure of the value added of jewellery or the income it leaves in the economy.
Outside this section, exports reach approximately $1.731 billion, by subtracting published amounts. This represents nearly two thirds of the total. This calculation makes it possible to estimate the size of other foreign sales, but not to establish their annual variation: the table by product presents, for 2025, a full year, not the nine corresponding months. A year-on-year increase or decline in « out-of-precious » exports would require a detailed extraction from January to September 2025. Reducing this evolution of the annual columns would lead to mixing different periods.
After precious and base metals, the main items are food preparations, at $331 million, mechanical or electrical machinery and appliances, at $286 million, and chemicals at $225 million. These five sets account for about 81.8% of the total value, calculated on rounded amounts. Plant products add 133 million, paper and works 70 million, plastics 68 million and miscellaneous manufactured articles 56 million. This distribution shows an identifiable export base beyond the precious, but concentrated on a limited number of large families.
Switzerland dominates destinations in value
Switzerland is the first country of destination in the Customs tables, with $674 million, or about 25.6 per cent of the total calculated and a published rounded share of 26 per cent. The United Arab Emirates is following 249 million, ahead of Turkey 134 million, Syria 133 million and Iraq 111 million. Together, these five destinations account for about 49.3% of exports. Jordan represents 97 million, Egypt 89 million and the United States 83 million.Source: Customs Bulletin, page 14.
This hierarchy is expressed in dollars. It does not classify the number of clients, the number of Lebanese exporters on each market or the tonnages. The high position of Switzerland and that of precious goods are two distinct findings in the document. Bringing them together can guide a research, but the newsletter does not contain a cross-table of products and countries. It therefore does not allow us to say what proportion of the 674 million shipped to Switzerland falls within the category of precious goods, or to deduce that other destinations buy mainly products manufactured in Lebanon.
The official method also specifies that the destination is the destination declared for export. It does not guarantee that the country indicated is that of final consumption. To assess commercial diversification, it is therefore necessary to distinguish between access to a customs destination and establishment with consumers or industrial customers. The multiplication of destinations is useful, but the available table does not measure the strength of contracts, their recurrence, or the dependence on an intermediary.
A partial table does not compare directly to a full year
The bulletin contains an important reading trap. On the product, country and office pages, column 2026 covers nine months while column 2025 presents twelve months. The variations shown are close to a comparison of monthly averages, not cumulations over the same period. For Switzerland, for example, the 674 million in 2026 is close to 784 million in 2025, with a change of 14%. The ratio between 674 divided by nine and 784 divided by twelve gives a similar increase, about 14.6%, without exactly replicating the percentage shown. It does not represent an increase of 14% between January-September 2025 and January-September 2026.
The same precaution applies to product headings. The 906 million precious goods of the first nine months of 2026 must not be compared directly to the 1.248 billion in 2025 to announce an annual decline. For total exports, the line explicitly titled « comparable period » on the first page is the relevant reference. The figure is 2.713 billion for January-September 2025. The addition of rounded months gives a slightly different amount; This justifies keeping the cumulation published rather than replacing it with a sum of already rounded values.
What Customs declarations measure
Customs value exports on a FOB basis, including expenses to the office of exit, and imports on a CIF basis, including transport and insurance to the customs office. The quantities and values come from declarations verified by the competent authorities; weight is recorded in net kilograms. Special export trade includes domestic goods, but also certain goods of foreign origin, particularly after they are put into consumption. Assimilating the total exported automatically to domestic production alone would therefore be inaccurate.Source: Statistical definitions of Customs.
Within this framework, the $2.637 billion exported cover approximately 16.9 per cent of the $15,600 billion imported in the first nine months of 2026. The merchandise deficit calculated on these two totals is 12.963 billion. These indicators shed light on the gap between purchases and sales of goods, without describing all external trade: they do not include revenue from services, transfers or financial movements. To judge market opportunities, the most robust results remain here the concentration of export values, their monthly evolution and the much greater decline in net weights.
An export order is not all the wealth created in Lebanon
The composition of foreign sales raises a question that the customs total cannot solve: what share of the invoiced value actually pays for an activity carried out in Lebanon? A product may incorporate materials purchased abroad, be processed locally and then sold to a non-resident customer. The declaration shall record the value of the goods crossing the border. It does not automatically separate the income of the Lebanese producer, that of its foreign suppliers and the remuneration of the various intermediaries.
This distinction does not disqualify channels using imported inputs. A company can create jobs, develop know-how and sell a competitive product while supplying abroad. It simply requires not to call « extra national wealth » the whole of an export invoice. To measure this input, intermediate consumption and value added must be identified. In order to measure the income of employees, it is still necessary to know the remuneration and employment.
The case of precious metals makes this problem particularly visible. An increase in the price of metal may increase the declared value of the same quantity. Additional design or manufacturing work can also increase the price of the product. The two mechanisms do not have the same industrial significance. Without weight, composition and processing information, the total entry does not distinguish them. It would be just as excessive to see it as a general manufacturing renaissance as considering any sale of jewellery as an activity without added value.
The analysis must therefore retain two levels. Customs statistics describe trade. Business surveys and production accounts describe the local economic content. An increase in the former may be a positive signal without sufficient evidence of the latter’s progress. This also applies to electrical equipment, food or metal products: a customs category is not a business and a destination is not an identified final consumer.
Grapes: an outlet is also chosen in the calendar
The public portal cardLEBTRADE dedicated to table grapesgives a more precise example of diversification. Exports range from $2024 million to $28.5 million for 10,666 tons, an increase of 30 per cent over one year. These data relate to fresh grapes intended for consumption, not wine or dried grapes. The United Arab Emirates is the top destination, while the Netherlands and the United Kingdom are also important.
The sheet identifies a winter commercial opportunity, particularly in December, but highlights the competition of South African, Peruvian and Chilean expeditions. It also describes the Netherlands as a European redistribution platform. The customs destination therefore does not always refer to the place where the fruit will be consumed. For a Lebanese producer, the market depends on the timing, type of buyer and product specifications, not just the annual volume imported by a country.
The economic mechanism is different from that of a simple race to size. A small exporting origin may seek a period during which its offer complements that of other suppliers. However, it does not have a reserved contract. A harvest lag or competing delivery may affect the commercial interest from one week to the next. The timetable is an information to be included in the negotiations, not a high price guarantee.
The quality requested must also be defined prior to batch preparation. Selling to a trader who redistributes in several markets does not necessarily impose the same characteristics as meeting the specifications of a sign. The relevant economic record therefore combines the product, the customer and the period. An increase in annual exports may come from better prices, more volumes or from another distribution of sales; It does not designate, on its own, which of these choices has succeeded.
Cherries and avocados: two trajectories, not a universal recipe
The series presented byLEBTRADE for Cherriesshow a much less steady trend. Export revenues increased from $1.339 million in 2020 to $4.532 million in 2021 and to $3.906 million in 2022. They fell to 1.088 million in 2023 and to 1.306 million in 2024. The recovery of the last year represents about 20%, but the level remains more than 70% lower at the peak of 2021, according to a calculation made on this series.
The difference between growth rates and levels achieved is decisive. A two-digit progression can repair a limited part of a previous decline. It does not establish a return to a sustainable trade position. This series, which was stopped at 2024, also does not make it possible to conclude on the crops or exports of 2026. It is used to show the volatility of a small sector, without automatically assigning to the quality of the fruits, to a military event or to the decision of a purchasing country.
The portal presents another trajectory foradvocateFrom $433,000 in 2021 to $8.2 million in 2024. The amount was multiplied by almost 19 from a low initial base. This growth signals the emergence of an outlet. It does not measure the profitability of each holding or the revenue a new plantation could obtain in the following years.
The two examples invite us to distinguish between expansion of a niche and transformation from all export economies. A market can progress very quickly when the starting point is modest. On the other hand, an installed sector can retain customers while experiencing a bad year. The size of the world market, the national performance and the situation of a producer are not interchangeable indicators. An investment strategy requires additional information on returns, resources mobilized and trade commitments.
Finance the order before receiving the payment
Sale abroad does not remove the need for cash. Between the purchase of materials, manufacturing and cashing, the exporter finances a transaction the payment of which sometimes comes later. ThelEBTRADE funding guidethese include commercial credit, equity participation and subsidies. These instruments do not address the same problem: financing a one-time order does not amount to financing a new production capacity.
The guide also recalls the interruption, after October 2019, of various subsidized bank loans for businesses. This historical indication does not make it possible to declare that no company can obtain financing in 2026. It shows why an exporting project must specifically verify the available instruments, their currency, duration and conditions. An offer mentioned in a portal does not constitute a credit approval or proof of disbursement.
The payment gap creates a constraint distinct from the commercial margin. An operation may generate a profit forecast while exceeding the company’s mobilizable resources. Accepting more orders does not necessarily solve the problem: this can increase the amounts advanced before cashing. Analysis of an export expansion should bring together production schedule, payment schedule and commitments already made.
This constraint also explains why an additional customer does not only provide a welcome diversification. It may request different payment terms, impose a first stock or leave part of the commercial risk to the exporter. Annual statistics record the goods shipped, not these contractual clauses. An increase in the number of destinations therefore does not automatically measure an improvement in cash flow.
The invoice issued and the receipt remain two steps
Thepublic guide on export risksidentifies the delay or default among financial risks. He referred to checks on the buyer, credit insurance and the choice of method of settlement. It also mentions the currency risk and the possible consequences of a change in the policy or administrative framework of the recipient country.
These elements have a simple translation: a sale is not secure only because the product has found a buyer. The contract must specify who must pay, when and in what currency. Protection can reduce a risk without removing them all. The choice depends on the conditions of the transaction and the guarantees actually available; no financial product can be presented as universally accessible or suitable for all Lebanese SMEs.
As a result, market diversification needs to be assessed from several perspectives. Distributing sales between multiple customers can reduce exposure to individual unpaid payments. Divided destinations may reduce exposure to administrative closures. However, several buyers in the same group or market may remain linked to the same risk. The country tables do not provide this information. They are the beginning of a diagnosis, not its conclusion.
Aid to businesses, with results on their right scale
The programmeUNDP Women Economic Empowerment, funded by Canada, provides an example of targeted intervention. Its announced budget is C$13 million out of 2024–31. The programme page shows 96 microenterprises and SMEs run by women who have received grants and technical support in agri-food, cosmetics and creative activities.
UNDP reports that as of December 2025, 93 per cent of the companies involved had access to new buyers. It reports an increase of 23% in turnover and 22% in full-time jobs. These results concern the group supported, according to the organization’s balance sheet. They do not demonstrate an equivalent increase in domestic exports and do not distinguish between new foreign customers and new domestic customers in this presentation.
The interest of this case lies in the association between financial means, equipment and commercial preparation. It also shows the necessary precautions to evaluate an export policy. The number of firms trained, the number of buyers met and the sales actually made measure different stages. The transition from one to the other must be documented. An accompanying indicator cannot replace an amount of exports, and a progression observed among beneficiaries alone does not prove the causal effect of the programme.
Accessible markets, but sales to be rebuilt
The diversification of Lebanese exports begins with a distinction between the legal opening of a market and the ability to sell regularly. Trade agreements reduce certain duties, while orders also depend on the origin of the goods, their compliance and relations with buyers. In 2026, two developments give this distinction a concrete scope: the Saudi reopening and the strengthening of the support tools for small businesses. They add to a long-standing preferential access to European markets, the existence of which is not sufficient to guarantee an increase in sales.
According to theEuropean CommissionThe Union absorbed 15 % of Lebanese merchandise exports in 2025. Its purchases in Lebanon amounted to approximately EUR 600 million, for a total bilateral trade of 6.1 billion. These amounts relate to goods, not tourism revenue or services. The Association Agreement, signed in June 2002 and entered into force in April 2006, provides duty-free access to Lebanese industrial products and most agricultural products. The wording counts: it does not amount to a universal exemption for each agri-food reference.
Theeuropean implementation report published in 2025states that 89% of processed agricultural and agricultural products benefit from duty-free and quota-free access, while 27 agricultural products are covered by special treatment, mainly tariff quotas. For a company, therefore, the diagnosis must fall to the product and its customs classification. A preference granted to a family of goods does not allow the procedure to be deducted from all its preparations. This verification precedes the calculation of a commercial offer and the choice of a distributor.
Preferential origin, a condition to be documented
Goods shipped from Lebanon do not automatically benefit from Lebanese preferential origin. Thefrench customsthe EU-Lebanon relationship is still linked to the former original protocol of the agreement. It shall include certificates EUR.1 or EUR-MED and, subject to conditions, declarations of origin on invoice. These are provided for small consignments or for an approved exporter with no value limit. The choice of evidence must correspond to the applicable regime, rather than to a mere documentary habit.
This point calls for special vigilance in 2026. Thememorandum from the European Customs Directorate-General on TARIC codesseparates agreements automatically referring to the revised Pan-Euro-Mediterranean Convention from those whose protocol retains its own rules. It specifically cites Lebanon in this second category. To present the new rules as uniformly applicable to all Mediterranean partners since 1 January would therefore be misleading. A manufacturer using foreign components must check the rule for its product and the possibilities of cumulation actually opened between the countries concerned.
Administrative preparation also begins on the Lebanese side. Theministry of Economy and Traderecalls the need to identify an importer or seller in the receiving country. It lists the customs declaration, the original commercial invoice, the packing list where the detailed information is not on the invoice and other documents required by the regulations. For European exports, it refers to the certification of origin in accordance with the relevant Protocol. The whole must describe the same operation: products, quantities and identity of stakeholders must be able to be reconciled.
Saudi reopening, an opportunity to win back
On 10 June 2026,saudi official agency SPAannounced the directive of Crown Prince Mohammed bin Salmane authorizing the resumption of Lebanese exports to the kingdom. Transmitted to Prime Minister Nawaf Salam by the Saudi Foreign Minister, she responded to a request from President Joseph Aoun and the Head of Government. The communiqué linked this decision to the commitments fulfilled and the steps taken by the Lebanese authorities. This is a concrete change in the access framework, with a political dimension explicitly assumed by Riyadh.
One secondsPA dispatch, dated 20 June, reports the launch of the resumption of exports during a ceremony at the port of Beirut, in the presence of Saudi Ambassador Fahd Al-Dosari. This step distinguishes the diplomatic announcement from its implementation. However, it does not measure the number of firms returning to the market, nor the value of the contracts recovered. To assess the economic effects of reopening, it will be necessary to track shipments and their composition over several months, rather than turn the ceremony into evidence of an already acquired recovery.
The regional framework provides another element. The public portalLEBTRADEpresents the Great Arab Free Trade Area as an exemption for eligible agricultural, agri-food and industrial products. It recalls the role of the certificate of origin, issued by the Chamber of Commerce and authenticated according to the nature of the product. The re-opening of a country and the tariff preference must therefore be examined together: the authorization to trade does not exempt from demonstrating the eligibility of each commodity for the treatment requested.
Selecting markets and preparing for compliance
European diversification also exceeds the Union. LEuropean Free Trade Associationwhich brings together Switzerland, Liechtenstein, Norway and Iceland, has an agreement with Lebanon covering industrial goods, including fish and marine products. Basic agricultural products are covered by complementary bilateral agreements. Therefore, an agri-food company cannot mechanically transpose an analysis for the Union to these four markets. The applicable concessions are reflected in the relevant text for the country and product.
The method proposed byLEBTRADE to prepare an export planconsists of examining a product-market relationship, then customers, competitors, distribution channels and local conditions. The portal explicitly provides for the possibility of abandoning a market which is not suited to the company’s offer. This selection avoids confusing diversification and multiplication of destinations. An SME can start with a limited number of references, identify the necessary partners and set sales and customer targets before expanding its scope.
An additional tool appeared on 16 February 2026 with the launch of theNational Trade Help Deskannounced by UNDP. Supported by the Department of Economy and Trade and supported by UNDP and Canada, this window targets micro-enterprises and SMEs facing business processes. The press release directs companies to the platform and their chambers of commerce. The challenge is to make existing agreements and arrangements usable: to obtain a response corresponding to the product, the market and the stage of preparation of the company.
Compliance precedes finding a new customer
ThelEBTRADE public guide on standardsdistinguishes between national requirements and those of the recipient market. In Lebanon, it identifies LIBNOR as a national standard-setting body. The Ministry of Industry is involved in monitoring general quality and safety requirements, while the Ministry of Agriculture is also involved in agricultural and agri-food activities.
Upon arrival, additional foreign requirements may apply. The portal cites the possibility of pre-shipment inspection and refers to European tools for technical, health and labelling requirements. The exporter must therefore verify the conformity of the concrete product he sells, and not only the country’s presence in a trade agreement. A tariff advantage does not exempt such controls.
For an SME, this distinction changes the order of decisions. Prospecting may begin before all the steps are completed, but delivery involves the company on a defined product. If the specification is examined only after manufacture, an adaptation may require the lot or its labelling to be taken over. The compliance document is part of the exportable offer, as is the product.
Next test will be repeat sales
After these verifications, the available data describe a recent adjustment in the values exported, not a uniform resumption of all branches. They show a strong place of valuable products, geographical concentration and commercial opportunities whose effects still need to be monitored. Agricultural examples point to the fact that rapid growth can come from a reduced base and that an annual rebound can leave a sector far from its best level.
The next customs bulletin will first see if the performances of August and September continue. An extraction by product and by destination, over the same months of 2025 and 2026, will then make it possible to distinguish the evolution of precious from that of other goods. It will also be necessary to measure the actual resumption of shipments to Saudi Arabia. The aggregated tables currently used do not answer these questions alone.
In order to appreciate productive diversification, it will be necessary to bring these exchanges closer to the companies that carry them out: new customers, repeated orders, investments and local added value. This rapprochement will avoid treating a good commercial operation as a general transformation of the country. Lebanon has products already sold abroad and identified commercial access. The documented issue is not to announce them again, but to verify that they give rise to regular, financial and actually cashed sales.
Cover: photo of the Beirut harbour in 2003,Ismail Küpeli,CC BY 2.0. Editorial adaptation and dressing assisted by IA, Libnanews. This illustration does not represent traffic of 2026.






Comments