


From the euphoria of valuations to the contraction of USTECH 100: the Nasdaq-100 returned around 25 500 points in session on 20 November. Bernard Raymond Jabre returns to the signal he had published before the reversal.
The signal had been issued before the rollover
On 28 August 2026, Libnanews published my study « Assessment of the valuation of AI shares ». The aim was not to deny the artificial intelligence revolution, but to measure the price already paid by the market for this revolution. The BRJ AI Valuation Cycle Index then came to about 82/100, an advanced phase of the recovery cycle: high valuations, very demanding expectations and reduced margin of error.
This alert was even earlier: on 20 May 2026, in « Artificial Intelligence, Financial Cycles and the BRJ Global Cycle Index », IA estimated in an area of 78 to 88/100, described as a phase of « advanced institutional euphoria ». It was therefore an ex ante diagnosis, several months before the summit in October.
What 82/100 meant
Technology can be revolutionary while being overpaid on the Stock Exchange. At 20, 40 or sometimes nearly 67 times the turnover, prices already incorporate several years of future growth. In the assumptions studied, the most extreme cases required income increases of up to 40 to 50 per cent per year for several years to normalize multiples without value destruction.
» Big bubbles are not born around absurd technologies. They are born around extraordinary truths… paid far too much. »
From the signal to the top, then to the turning
| Date | Nasdaq-100 | Event | Cyclical reading |
|---|---|---|---|
| 28 august 2026 | 29 433.43 | Publication of the IA valuation study | BRJ AI Index |
| 6 october 2026 | 31 224,69 | Closing summit observed | Terminal cycle extension |
| 28 october 2026 | 29 813.16 | T0 of the BRJ Global Cycle Clock | Mature Bull / cyclical shift |
| 20 november 2026 | 25 500 (in meeting) | Deep correction | Contraction — ~1h30 to 2h00 estimated |
Between 28 August and the 6 October summit, the Nasdaq-100 still won about 6%. This is normal in a cyclical reading: identifying an extreme valuation area does not mean pretending to know the last point in the market. Since the peak, the index has declined by around 18%. Compared to 28 August, the decrease is now close to 13%, and compared to the T0 of 28 October it is approaching 14%.
The three historical levels are Nasdaq-100 fences published by Nasdaq and broadcast by the St. Louis Federal Reserve. The level indicated for November 20 is a benchmark during the session, not a closing course.
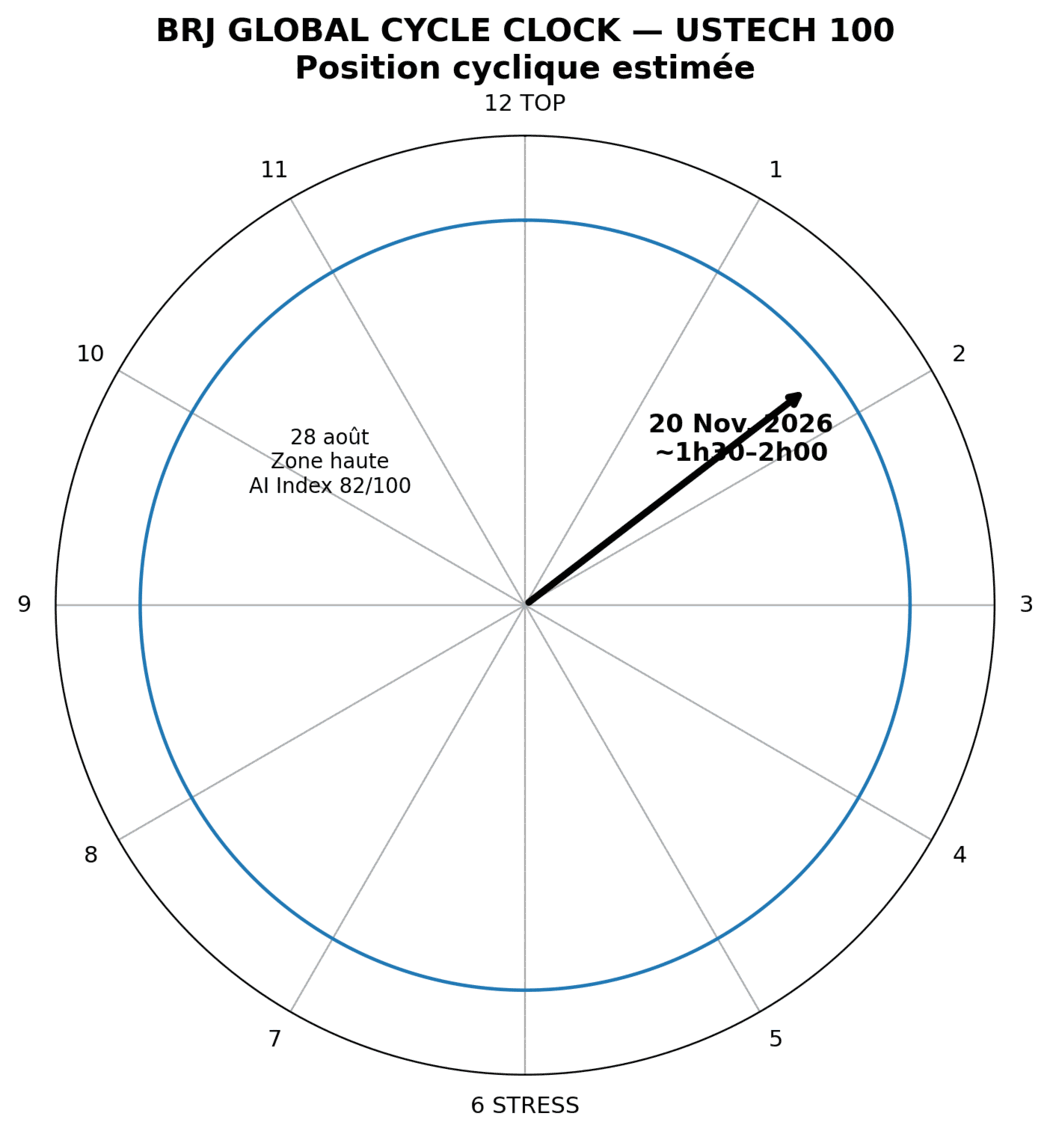
Where are we today on the clock?
The current reading probably puts the USTECH 100 around 1h30–2h00 on the BRJ clock: after the 12h Top/Euphoria and Distribution around 1h, the market would now have entered the Contraction phase. This position is an estimate of the BRJ model and not a chronological measurement: the clock measures the state of the cycle, not the number of days elapsed.
The BRJ model is an author-specific analytical tool; its position is neither official market data nor a guarantee of future performance.
The key point is that the correction alone is not sufficient to declare the cycle completed. A downward phase may involve violent rebounds. To consider that the contraction process is complete, sufficient standardization of valuations, positioning, liquidity and trend and momentum indicators will be necessary.
Conclusion: AI continues, but its stock market cycle has changed
Artificial intelligence is probably not at the end of its technological history. But the stock market can perfectly correct several years of excessive anticipation as technology continues to grow.
This is precisely the distinction made by the analysis published in May and then in August: do not confuse the power of an industrial revolution with the price that an investor has to pay to participate.
We were then in the upper part of the cycle. Today, market data indicate that we have moved on to its descending phase. The question is no longer whether the valuations were strained, but how far their normalization will have to go before the yield/risk pair becomes truly attractive again.





Comments