

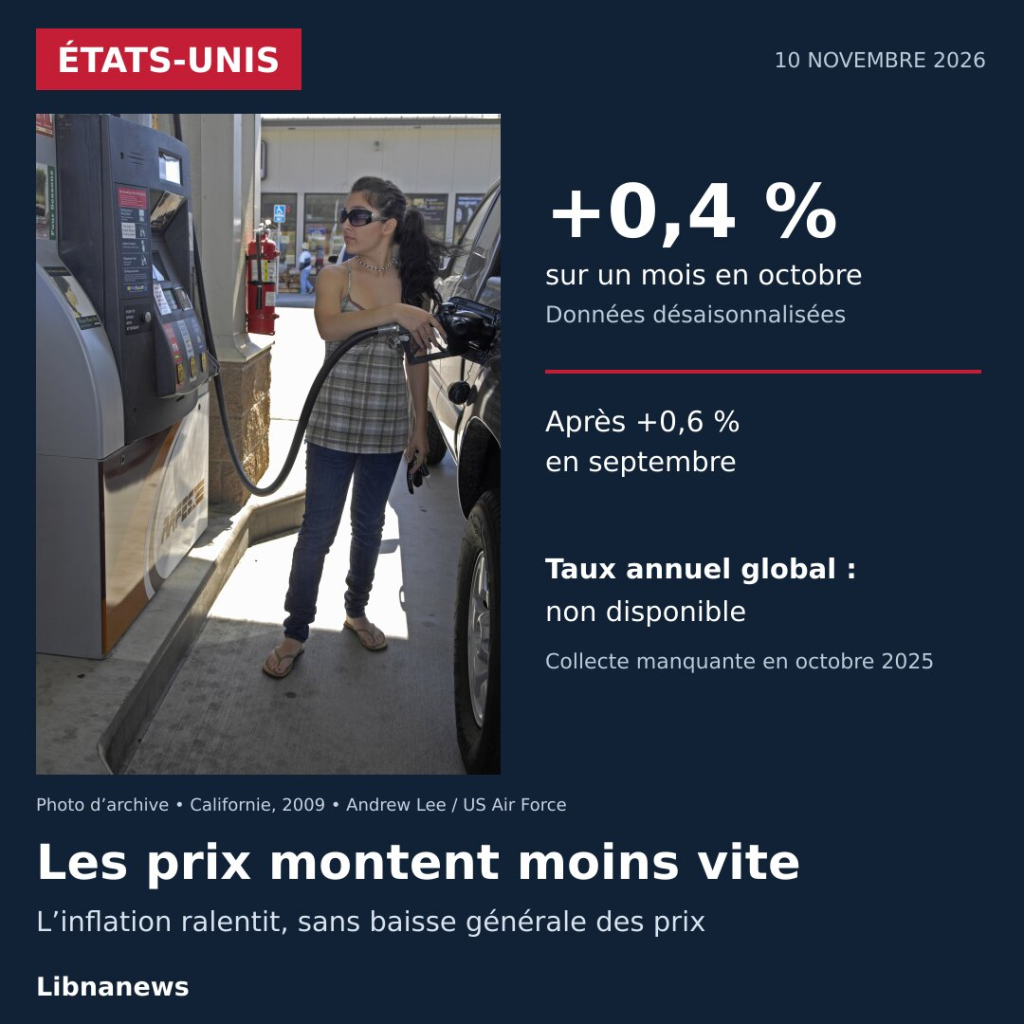
US inflation slowed down over a month in October 2026, without giving way to a general fall in prices. The consumer price index rose by 0.4%, after 0.6% in September, in seasonally adjusted data. The survey published on Tuesday 10 November also confirms an underlying increase of 0.3%. But no overall annual rate can be published: the missing collection of October 2025 prevents this comparison.
US inflation is slowing down, prices are still rising
The figure for October concerns the ICC-U, the index covering urban consumers in the United States. It measures the average variation in a basket of goods and services. The monthly increase returns to its August pace, after the acceleration of September. The movement remains positive: the basket costs more than a month before.
The distinction counts for households. A slowdown means that prices are rising slower. He does not reimburse any accumulated increases. Expenditure on each household may also change differently from the national average. The weight of housing, travel and food varies depending on the situation.
Without food and energy, the index rose 0.3% in October, as in September and August. This unchanged rate therefore increases the overall figure. Monthly relaxation does not affect all components of the basket evenly. Services and several current expenditures continue to grow.
Why the annual rate is missing this month
The publication has a major feature. The interruption of federal funding had prevented the collection of survey data in October 2025. Most of this month’s indices could not therefore be published. One year later, their absence prevents the calculation of the corresponding 12-month changes.
The official table thus leaves empty the annual variation of the general index and that of the non-food and energy index. This gap does not mean zero inflation or a suspension of the current measure. Monthly data for October 2026 are available. This is the point of comparison of October 2025 missing.
However, some series have a comparable basis. Gasoline increased by 37.4% over one year. New vehicles are up 0.7%, while used vehicles are down 3.3%. These exceptions do not allow for the reconstitution of an official annual rate for the basket as a whole.
Energy brake clearly after the September shock
Energy increased by 0.7% in October, after 5.2% in September, in seasonally adjusted data. Gasoline rose from 9.1% to 1%. This deceleration greatly reduces the intensity of the energy movement. However, it leaves prices adjusted for seasonal effects upwards.
Electricity grew by 0.9% per month. The gas distributed by network is down 0.8%. To talk about a uniform decrease in energy bills would therefore be incorrect. Developments differ according to the products and services concerned.
Seasonal correction deserves special attention here. Before this adjustment, gasoline fell by 0.7% in October. After correction, it increases by 1%. The two figures answer different questions: the first describes the gross change, the second removes movements usually related to the season.
This method facilitates comparison of trends from month to month. It avoids confusing a usual seasonal fluctuation with a lasting change. It also explains why a decrease in some expenditure may coexist with an increase in the seasonally adjusted series.
Housing and food maintain the increase
Housing increased by 0.3% in October, after 0.4% in September. This component represents more than 30% of the monthly increase in the general index. Rent increases by 0.2%. The rent charged to the owners, who estimate the housing service they occupy, earns 0.3%.
Food goes up again after a month of stability. Its index increases by 0.5%. Home food purchases increased by 0.4 per cent, compared to a 0.1 per cent decline in September. Out-of-home meals increased by 0.5% in a seasonally unadjusted series.
In food stores, four of the six major product families are increasing. Meat, poultry, fish and eggs together grow by 0.5%. Fruit, vegetables and dairy products each earn 0.6%. Non-alcoholic beverages decreased by 0.3%, while cereals and bakery products remained stable.
| Component | September 2026 | October 2026 |
|---|---|---|
| General index | +0.6% | +0.4 % |
| Non-food and energy | +0.3% | +0.3% |
| Energy | +5.2 % | +0.7% |
| Food | 0.0 % | +0.5 % |
| Housing | +0.4 % | +0.3% |
Changes from the previous month, seasonally adjusted. These monthly rates are not annual rates.
More expensive services, used vehicles in decline
Recreation increased by 0.8% in October. Car insurance increases by 0.7%, education by 0.3% and new vehicles by 0.2%. Health expenditures are 0.3% higher overall. Within this group, hospital services are up 0.8%.
Conversely, used cars and trucks fell by 1.2%, after an increase of 0.7% in September. Communications are down 0.1 per cent. These one-off declines amortize part of the increases recorded elsewhere. They are not enough to lower the general index.
Prior to seasonal correction, the CPI-U increased by 0.2% in October and reached 337.511 points, based on 100 in 1982-1984. This level of index should not be confused with an inflation rate. The next publication, dedicated to the November awards, is scheduled for 10 December 2026 at 8:30 in Washington.
Photo archive: a customer fills up in Vandenberg, California, August 24, 2009. Andrew Lee / US Air Force, United States public domain. Layout Libnanews; the data displayed relate to October 2026.





Comments