

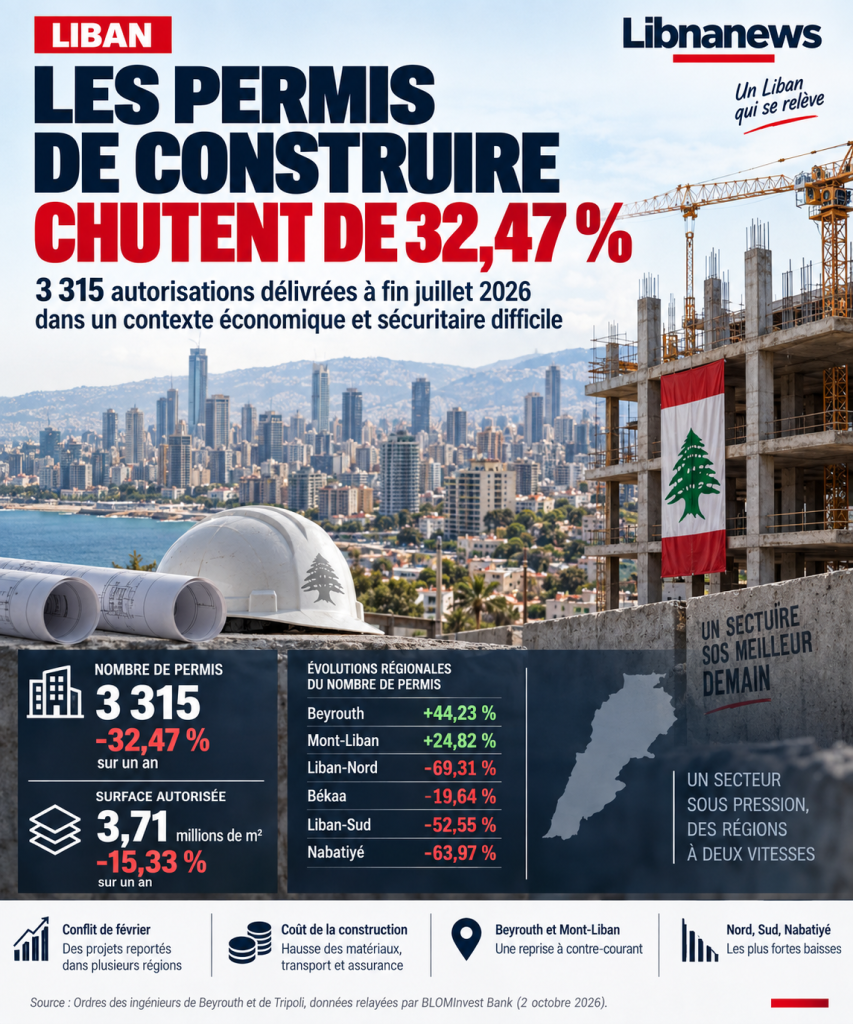
Thenumber of construction permits in Lebanonhas dropped by 32.47 per cent over a year in the first seven months of 2026, to 3,315 authorizations, according to data from the Beirut and Tripoli Engineering Orders published on Friday, 2 October. The slowdown particularly affects Northern Lebanon, South Lebanon and Nabatiyah. Beirut and Mount Lebanon, however, escape this trend and are experiencing a rebound. The total permitted area also decreased, but more moderately, from 15.33% to 3.71 million square metres.
Only 3,315 construction permits in Lebanon
Construction activity has slowed sharply in Lebanon since the beginning of the year.
Between January and July 2026,3,315 building permitshave been issued. Their number fell by 32.47 per cent from the same period of 2025 when it reached 4,909.
The contraction occurred after a first decline of 24.03 % a year earlier. At the end of July 2024, Lebanon still had 6,766 permits.
The current level also appears to be much lower than a few years ago. By the end of July 2022, 7,766 authorizations had been identified. They had fallen to 6,531 in July 2023, before slightly increasing in the following year.
The available series therefore shows a particularly marked deterioration since 2024.
| Period, cumulation to July | Number of permits | Annual change |
|---|---|---|
| 2022 | 7 766 | — |
| 2023 | 6,531 | -15.90 %* |
| 2024 | 6,766 | +3.60% |
| 2025 | 4,909 | -24,03 % |
| 2026 | 3,315 | -32,47 % |
*Calculated from published data.
Between July 2022 and July 2026, the cumulative number of permits decreased by more than half. However, the comparison should be conservative: the permit is an indicator of construction intentions and authorizations, not a direct measure of buildings actually started or completed.
February conflict slows down new projects
The decline in 2026 mainly reflects the postponements of new projects following the February conflict.
Security uncertainty has affected the decisions of promoters and investors. The continuation of Israeli strikes maintained this caution until July, particularly in the areas directly exposed.
To this factor adds the cost of construction.
Higher material prices increase project funding requirements. Transport and insurance costs are also high. Their combination increased the cost of launching new construction sites and may lead promoters to defer their investments.
This helps explain the 32.47% decrease in permits issued.
However, it does not affect all regions with the same intensity. The figures show a clear geographical divide between Beirut and Mount Lebanon, on the one hand, and several other governorates, on the other.
Beirut and Mount Lebanon resist down
Beirut is one of the two exceptions.
The capital recorded75 permitsbetween January and July. Their number increases by 44.23 per cent over one year. Beirut, however, accounts for only 2.26% of all permits issued in Lebanon.
The Mount Lebanon also shows a progression. With1,780 permitsactivity increased by 24.82 % compared to the same period of 2025.
This development is of greater national importance. Mount Lebanon alone53.70 % of permitsissued in the first seven months of the year.
More than one in two permits is therefore in this governorate.
The increase in these two regions was not sufficient to compensate for the collapse elsewhere.
| Government | Permit at the end of July | Share of total | Annual change |
|---|---|---|---|
| Beirut | 75 | 2.26% | +44.23 % |
| Mount Lebanon | 1 780 | 53.70 % | +24.82 % |
| Northern Lebanon | 407 | 12.28 % | -69,31 % |
| Bekaa | 315 | 9.50% | -19,64 % |
| South Lebanon | 502 | 15.14 % | -52,55 % |
| Nabatiyah | 236 | 7.12% | -63,97 % |
| Total | 3,315 | 100 % | -32,47 % |
Northern Lebanon recorded the strongest contraction
The largest decline is in Northern Lebanon.
Only407 permitsat the end of July 2026, a fall of 69.31% occurred in one year. The region now accounts for 12.28 per cent of national authorisations.
Nabatiyah posted the second most pronounced decline. The 236 permits recorded represent a 63.97% decrease.
South Lebanon is also experiencing a major contraction. The number of authorisations fell to 502, down by 52.55 per cent.
The Bekaa is more resistant. It totals 315 permits, but still shows a decrease of 19.64 per cent.
These developments explain how the national total can significantly decrease despite increases in Beirut and Mount Lebanon.
The weight of these contractions is particularly important in North and South Lebanon. Together, these two governorates represent only 909 permits during the period under review.
Permitted surfaces decrease by 15.33%
A second indicator, however, is the extent of contraction.
Thecumulative area permitted by building permitsincreased to 3,711,690 square metres at the end of July 2026. It decreases by 15.33% over one year.
This decrease remains significant, but is twice as much as the number of permits, which is 32.47 per cent.
The difference between the two indicators means that the reduction in the number of authorisations did not translate into a proportional contraction of the authorised areas.
In other words, permits issued in 2026 cover on average larger areas than those of the same period of 2025. This conclusion is mathematically drawn from the two aggregate series, without allowing the nature of the projects concerned to be determined by itself.
Regional data again show very different trends.
Mount Lebanon concentrates 56% of the surface area
Mount Lebanon dominates the market.
The permits granted in this governorate represent2,084,536 square metres56.16 per cent of the total area authorized in Lebanon at the end of July.
The annual increase is 38.26%.
Beirut is seeing an even stronger development. The authorized area is 294,721 square metres, up 84.17%. The capital represents 7.94 per cent of the national total.
These two increases contrast with the contraction in the other four areas presented.
The North has 388,979 square metres of authorized surface area, a fall of 63.50 per cent. It now accounts for 10.48% of the total.
In Nabatiyah, the area fell by 65.24% to 140,176 square metres.
South Lebanon recorded 475,067 square metres, down 42.87 per cent, while Bekaa reached 328,211 square metres, a decrease of 21.04 per cent.
| Government | Authorized surface area | Share of total | Annual change |
|---|---|---|---|
| Beirut | 294,721 m2 | 7.94 % | +84.17 % |
| Mount Lebanon | 2,084,536 m2 | 56.16 % | +38.26 % |
| Northern Lebanon | 388 979 m2 | 10.48 % | -63,50 % |
| Bekaa | 328 211 m2 | 8.84 % | -21,04 % |
| South Lebanon | 475 067 m2 | 12.80 % | -42,87 % |
| Nabatiyah | 140 176 m2 | 3.78 % | -65.24 % |
| Total | 3 711 690 m2 | 100 % | -15,33 % |
An increasingly geographically concentrated activity
The figures adopted in July thus draw a two-speed construction market.
At the same time, Beirut and Mount Lebanon registered an increase in the number of permits and authorized surfaces. The other four identified regions show a decrease on both indicators.
This divergence is particularly visible in the distribution of surfaces.
Both Beirut and Mount Lebanon concentrate64.10 % of authorised surfacessince January. For the number of permits, their cumulative share is 55.96 per cent.
Mount Lebanon is the main driving force behind this concentration. It brings together more than half of the authorisations and square metres approved at national level.
Conversely, the North Lebanon, Nabatiyah and the South Lebanon have particularly pronounced contractions. In each of these regions, the number of permits decreased by more than 50% over a year.
The next data will help determine whether the rebound of Beirut and Mount Lebanon can continue in the second half of the year and whether the other governorates are beginning to catch up. At the end of July, the national assessment remains that of a net contraction:3,315 permits were issued, almost a third less than a year earlier.





Comments