


Prior to 2019, several IMF models identified an overvaluation of the Lebanese pound, with results ranging from 9.1% to 66% depending on the method and scenario. Since the stabilization around 89 500 LL/USD, rising domestic prices can further degrade relative prices. However, both periods differ in terms of funding, balance sheets and dollarization. The analysis must separate these mechanisms to determine what happens again and what has changed.
Three questions are used to test the comparison. Does the nominal price keep Lebanese goods and services at a price compatible with foreign markets? Do foreign currency inflows finance the country’s needs in a sustainable manner? Finally, what is the effect of a change in the exchange rate on debts, deposits and income, according to their currency? The answers do not deduce themselves from the only stability of the dollar or its absolute level.
The3,000 LL/USD before 2019is considered here as a hypothesis: no primary study identified in the documents consulted allows it to assign exactly this value with a verifiable date, method and assumptions. IMF assessments provide a diagnosis of misalignment, not a single nominal parity. The following calculations distinguish observations, published model results and simulations constructed to isolate a mechanism. The data available are as at 8 November 2026.
1. Definitions: nominal rate, real rate and balance
Thenominal rateis the number of books needed to get a dollar: 1 507.5 yesterday, 89 500 as current reference. It is an observable price, with concrete conditions. It should also be clarified whether it is a dollar available in cash, an international transfer, an old bank entry or a rate applied to a regulated transaction. A claim expressed in dollars, but impossible to withdraw freely, does not have the same liquidity as a note.
Thereal ratecompare prices after conversion into a common currency. With E expressed in pounds per dollar, a bilateral indicator can write E × foreign prices / Lebanese prices. In this convention, a decline means a real appreciation: the Lebanese basket becomes relatively more expensive. Other indices use the reverse convention. Always read the definition before interpreting the direction of a curve.
Theactual effective exchange rateor TCER, expands this comparison to several trading partners, with weights. It is therefore neither the dollar nor the price of a few products in Beirut. The IMF clearly distinguishes these measures in itsexplanation of real exchangeand inmethodology of its actual indices.
Finally, thebalance rateis a model result: the level compatible, under certain assumptions, with productivity, trade, external assets, financing flows and a sustainable economic trajectory. It is not directly observable. An estimate can change when the price of energy increases, when a war destroys productive capacities or when diaspora transfers change over time.
The choice of a base year does not solve this difficulty. A real index equal to 100 only means that it returns to its chosen year level. If this year was already unbalanced, returning to 100 does not magically restore balance. Similarly, a stable price for several years can be perfectly sustainable in a productive economy, but increasingly expensive in an economy that loses its external revenues.
2. What the models actually said before 2019
The verifiable reference is Annex II to the2019 IMF Article IV report, dedicated to the 2018 external evaluation. It presents four results which must be kept separate: 50 per cent overvaluation with a stabilized net external position to -128 per cent of GDP; 66 per cent to -100 per cent in 2024; 63 per cent with the current account approach; 9.1% with the IREER approach. The report itself highlights data quality problems and the effects of the Syrian conflict.
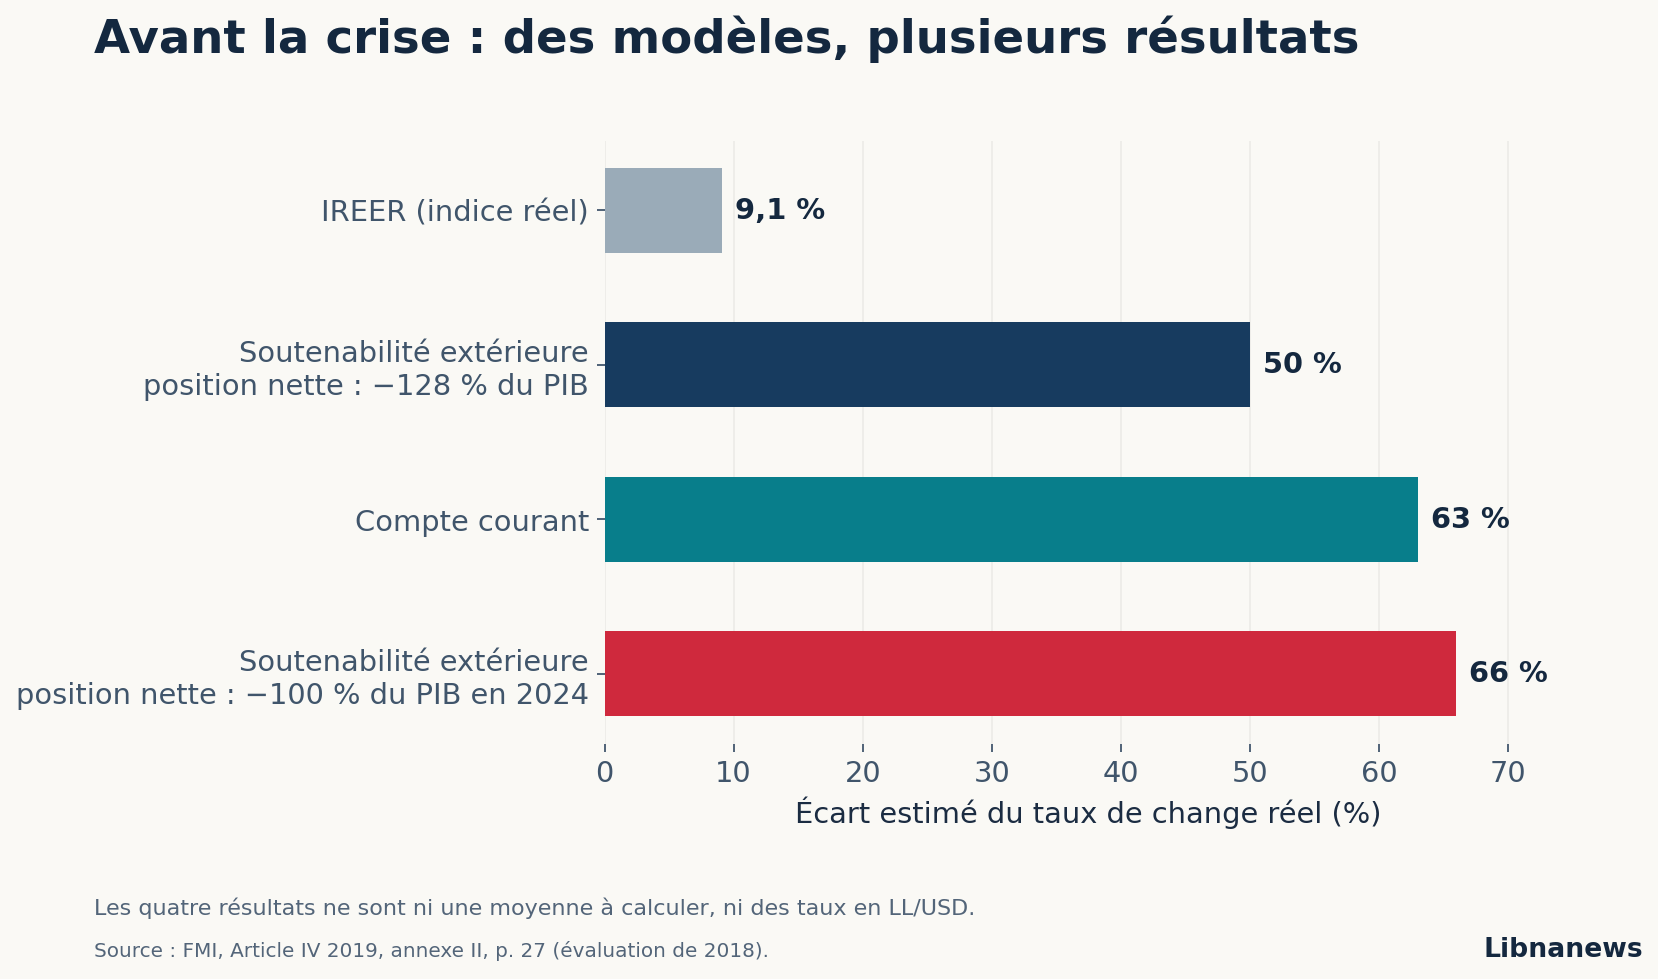
This dispersal provides important information. A current account model asks what correction could bring foreign trade and income closer to a level considered compatible with the country’s characteristics. Instead, a sustainability model examines the trajectory of net external assets and obligations to be financed. A regression of the real index exploits an estimated relationship between the exchange rate and its determinants. The questions differ; the answers too.
It would therefore be incorrect to add up the four digits, to take their average and to baptize the result « real value of the book ». They do not constitute four independent surveys of the same course. The two sustainability results, in particular, reflect two different targets for the same family of calculations. They are not the limits of a statistical confidence interval.
The figure of 3,000 can nevertheless be used to explain a reasoning, provided that it remains a hypothesis. If one assumes a sustainable price of 3,000 instead of 1,500, the price of the double dollar and the dollar value of a pound is divided by two. To say that the dollar must rise by 100% and that the pound must lose 50% then describes the same operation with two different denominators. This asymmetry explains part of the confusion in the public debate.
It also prohibits mechanical conversion of a « 50% overvaluation » of a real index into a dollar at £3,000. It is necessary to know the model convention, the definition of the difference, the prices chosen and the expected reaction of these prices after adjustment. A real rate calculation does not directly provide a nominal exchange rate estimate. Even an arithmetically correct formula can become economically false if it assumes that all other prices will remain stationary.
3. Imports and production: isolating the effect of exchange
For an import invoiced in dollars, the price before taxes and margins checks a simple relationship:price in pounds = rate LL/USD × price in dollars. A $100 billed asset costs £150,000 at a 1,500 class, compared to $300,000 to 3,000. With a temporarily unchanged income of £1.5 million, purchasing power is increased from 10 to 5 units. This is a conversion effect, calculated on the assumption that the supplier, taxes and margins do not change.
The local producer is affected by the reverse conversion. A domestic cost of £150,000 is $100 to $1,500, but $50 to $3,000. If this cost is a salary or rent that does not adjust immediately, the depreciation reduces its dollar equivalent. If the contract is indexed to the dollar, the gain disappears as soon as the amount in pounds is revised.
The impact on competitiveness therefore depends on the share of costs actually paid in local currency. Consider three companies with an initial cost of $100. In this simulation, the price of the dollar increases by 20 per cent, costs directly denominated in dollars remain fixed and costs in books are not yet revalued. Their cost after change is: share in dollars + share in pounds / 1.20.
| Share of fixed costs in pounds | Initial cost in dollars | Cost after 20 per cent increase | Cost decrease in dollars |
|---|---|---|---|
| 20 % | 100 | 96.67 | 3.3 per cent |
| 50 % | 100 | 91.67 | 8.3 % |
| 80% | 100 | 86.67 | 13.3% |
An activity using a lot of unindexed domestic work can therefore benefit more from depreciation than an activity dependent on fuel, components and rents paid in dollars. If half of the assumed fixed book costs are ultimately indexed, the central case gain falls from 8.3% to 4.2%. With full indexing of all costs, it becomes zero in this model.
This distinction explains why the level of exchange is not sufficient to predict exports. It is necessary to know the selling price, unit cost, import share, contracts and volumes that the company can deliver. An improved margin can finance a fall in prices abroad, but can also be absorbed by repayment of a debt, repair or increase in freight. The transition from exchange to competitiveness is a chain of decisions, not an accounting identity.
Conversely, a price maintained at too high a level favours relatively imported goods and increases domestic costs converted into dollars. This mechanism is not sufficient to establish that all imports are excessive: machinery and inputs can increase future production. The imbalance arises when the level of external expenditure exceeds the sustainable revenues and financing that it generates.
4. The external need: compare the amounts and their financing
Theworld Bank Lebanon factsheet of October 2026provides a revised series to compare years without mixing statistical vintages. The current account deficit reached $13.37 billion in 2018, $9.26 billion in 2025 and $8.31 billion in the 2026 estimate/projection. Compared to GDP, these amounts represent 24.2%, 25.1% and 21.3% respectively.
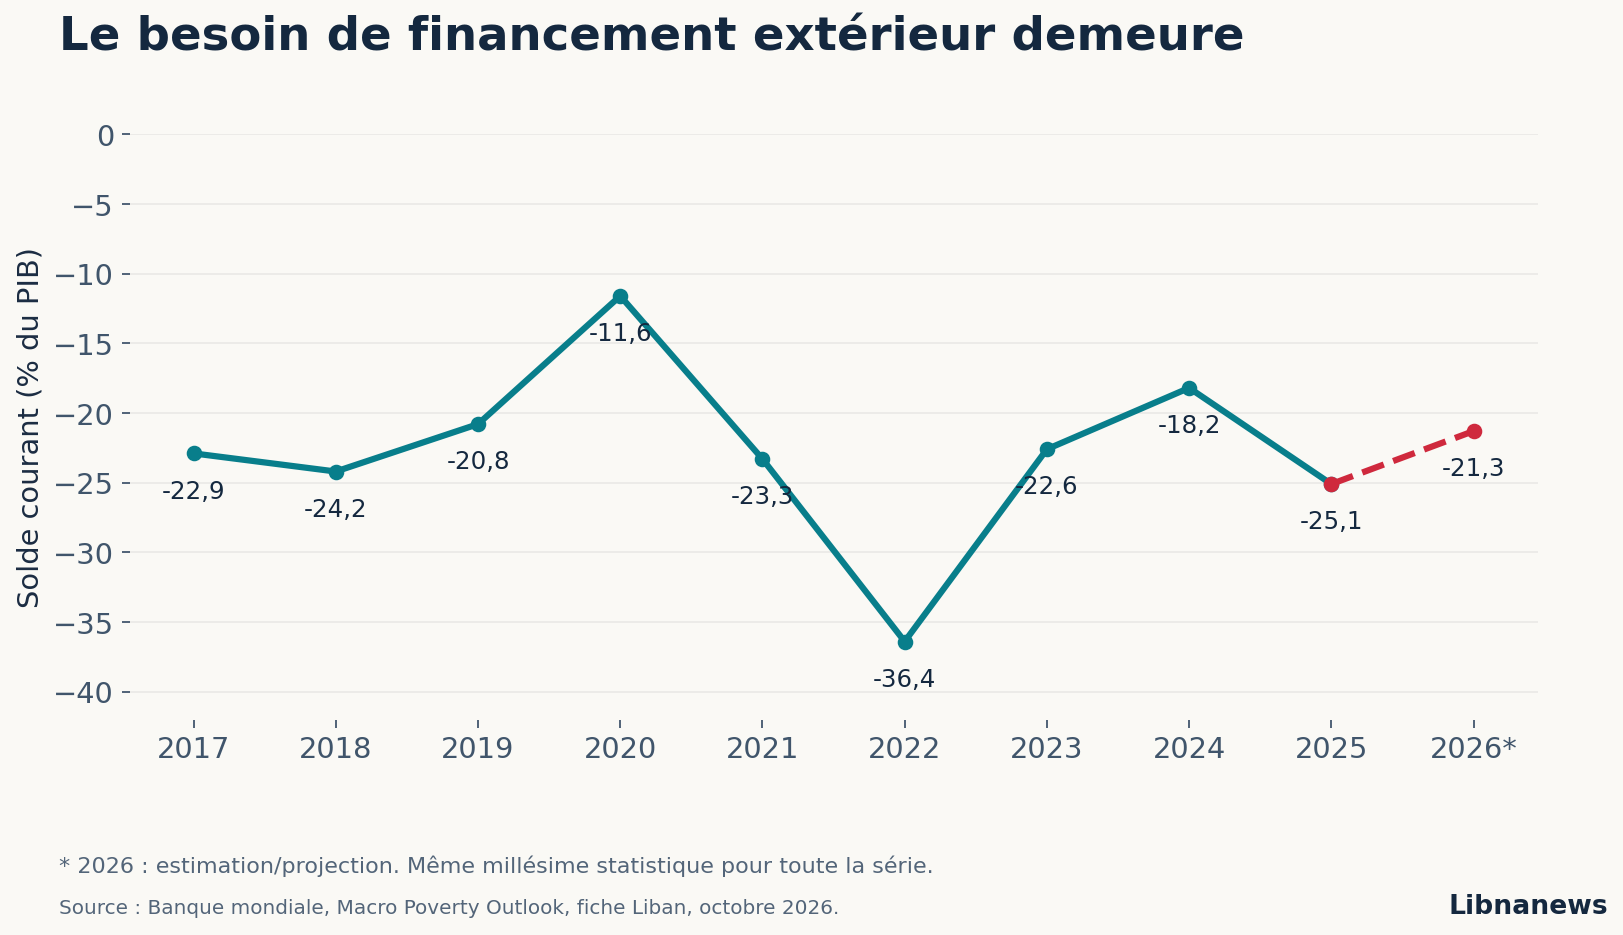
The comparison produces two different results. Between 2018 and 2025, the annual external need decreased by approximately $4.10 billion, or 30.7 per cent. But its weight in GDP increases by 0.9 percentage points. The country must finance a lower amount, with a smaller economy itself. It would therefore be incomplete to claim that external dependence has been reduced because the dollar deficit has fallen.
The current account includes goods, services, revenues and current transfers. Some of the resources of the diaspora and the spending of foreign tourists are already included. Then add them in full as new financing of the current account deficit would be a double account. On the other hand, direct investment, certain loans and deposit movements are externally financed according to their accounting nature.
In a simplified representation, the current account deficit must be covered by net off-reserve funding or by a decrease in reserve assets. To reconcile actual data, it is also necessary to integrate the capital account, errors and omissions as well as sign agreements. This identity shall indicate the accounting contribution to the deficit ; It does not identify its origin alone.
Suppose a current deficit of 10 billion, net off-reserve financing of 8 billion and no other items. The levy on reserves is 2 billion. If inflows fall to 5 billion while spending does not adjust immediately, the need for reserves increases to 5 billion. A financing crisis can therefore become acute without an initial increase in imports: the supply of capital has contracted.
The duration and return of funding then changes the risk. A capital contribution to an export activity shares any losses with the investor. A quickly due deposit creates a liquidity obligation. Short-term financing used to support long or low-liquid assets may become vulnerable to withdrawals even if assets have not yet been sold at a loss.
This framework makes it possible to distinguish two causalities often confused. Unfavourable real exchange may contribute to the trade deficit. But a cut in capital can cause parity to break before the trade deficit deteriorates further. Both mechanisms can be strengthened; their respective contribution requires a flow analysis, not just a course observation.
5. Interest rate and credit allocation: defence cost
To attract or retain currencies, banks can increase the return on investments. Inflow then improves immediate liquidity, but creates interest to be paid. The decisive variable is the difference between the promised return and that of the assets actually financed, after taking into account risk and losses.
In a cost-free or unpaid example, $100 collected at 10 per cent and placed in an asset that accounts for 6 per cent of the income gap is $4 per year. The initial stock of currencies is well present, but the return on assets does not cover the return on liabilities. This calculation is a balance sheet model, not a reconstitution of average BDL or bank rates.
The same arbitration concerns productive credit. A loan of $100,000 to 5% costs $5,000 in annual interest; At 10%, it costs 10,000. A project with an interest margin of $8,000 becomes a deficit in the latter case. The increase in the rate needed to hold deposits can thus reduce investments capable of generating future external revenues.
Pre-crisis data provide an index of balance sheet displacement. In July 2019iMF missionreported that government securities and investments in BDL together accounted for approximately 68.5% of bank assets, while noting a contraction in credit to the private sector. This concentration measures a common exposure; it does not prove that each private loan refused would have been profitable.
The channel is nevertheless identifiable: high public or quasi-public pay increases the minimum return a bank requires from risky credit. A company must then create a stronger margin, provide more guarantees or reduce its investment. If its income is in books and its financial expenses in dollars, a possible exchange rate break adds a balance sheet risk to the operating risk.
The defence of parity can thus have two simultaneous costs: a direct cost in reserves when missing currencies are to be supplied, and an indirect cost when financing becomes too expensive for certain activities. In order to measure these costs in Lebanon, it would be necessary to reconcile series of yields, maturity, credit volumes and losses. The simple deposit totals do not allow this calculation.
6. Reserves: gross stock, liabilities and liquidity
The word « reserves » often gives a misleading impression of freely available treasure. A central bank can hold assets in dollars while having heavy foreign currency bonds. Watching only the asset amounts to looking at the balance of an account without examining the debts that correspond to it.
At least four objects must be distinguished: external accounting assets; reserve assets meeting liquidity and residency requirements ; net reserves after certain commitments ; and the liquidity actually available for a given transaction. The gold must be presented separately when speaking of available dollars. Its valuation varies with international prices and its mobilisation raises other economic and legal conditions.
TheiMF report of 2023provides a homogeneous set of gross, gold-free and asset-shared reserves: $31.4 billion in 2018, $24.5 billion in 2019, $17.7 billion in 2020, $13.6 billion in 2021 and $10.6 billion in 2022. The decline between the two ends is 20.8 billion, or about 66%. This calculation describes a decline in assets; It does not automatically attribute the whole cause to a single policy.
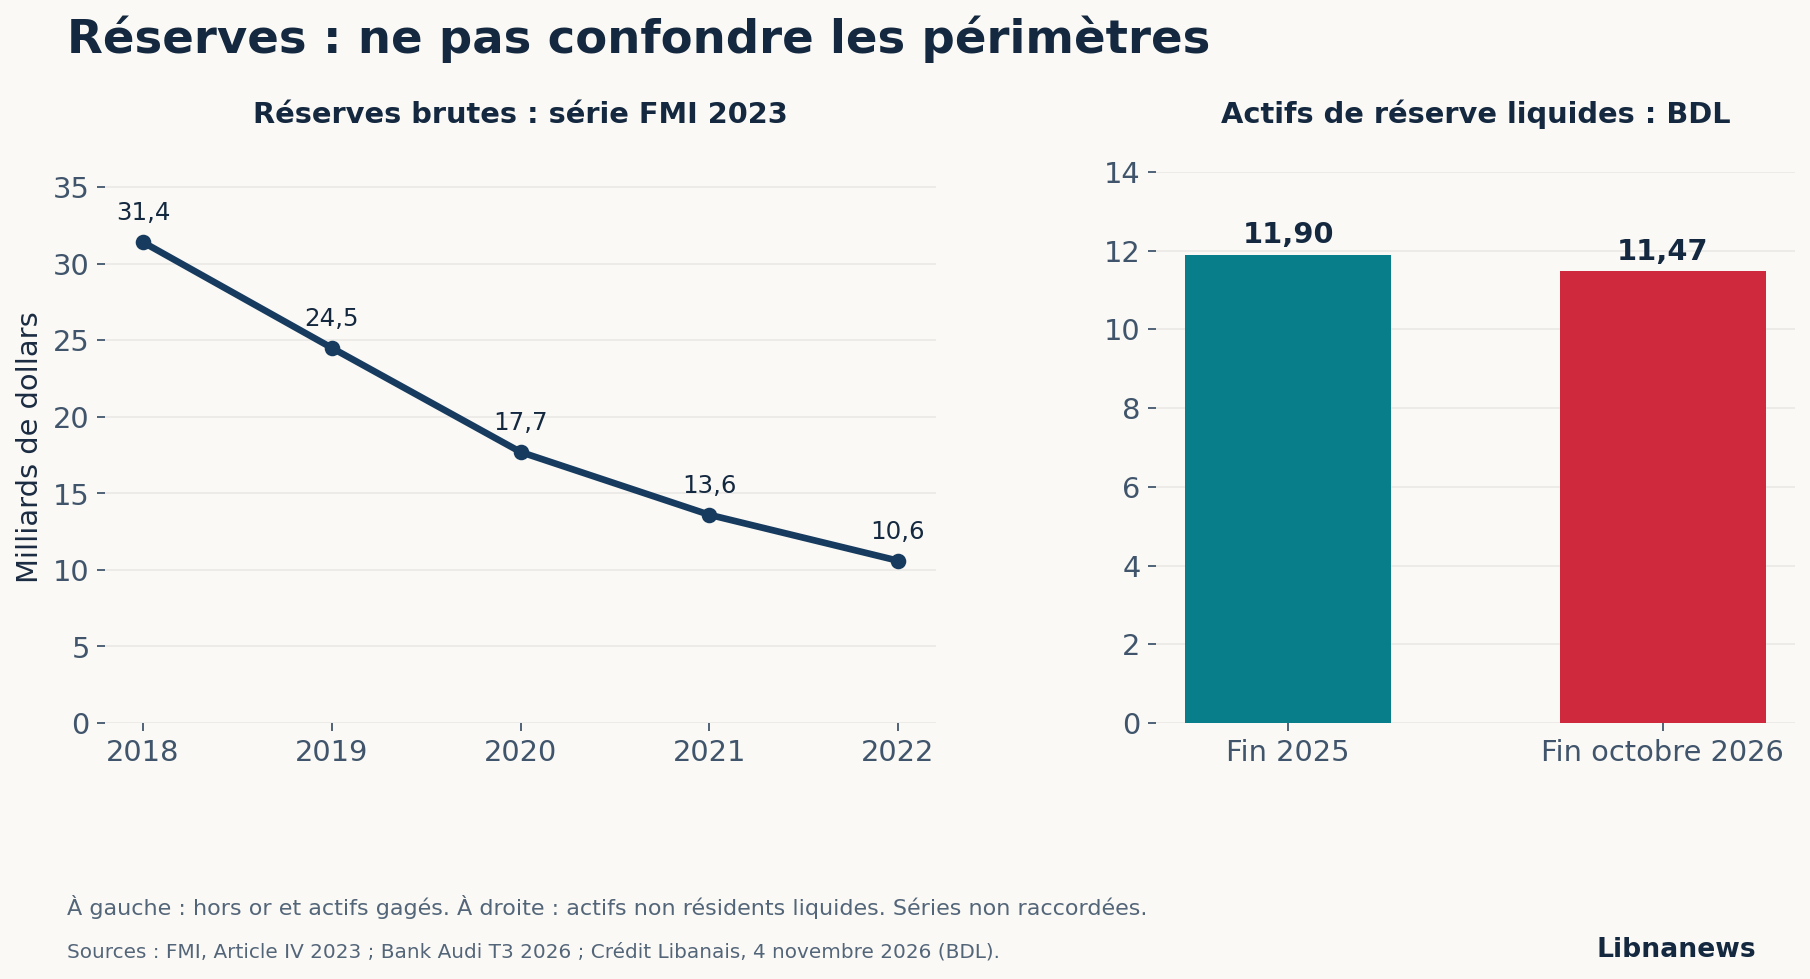
Foreign exchange protection, financing of certain imports, external payments and other operations should not be confused. To accurately attribute the decline, a comprehensive and reconciled decomposition of flows would be required. It would be abusive to write that every dollar of lost reserves was used to maintain the rate of 1 507.5, as it would be abusive to conclude that the defence of the rate cost nothing.
The general mechanism is simple. When the demand for dollars at the forbidden price exceeds the private supply, the central bank provides the difference if it wants to keep the price. She receives books and disposes of an external liquid asset. The operation can stabilize the market during a temporary shock. It becomes problematic if the imbalance persists and the reserves are restored only by costly new obligations.
An analogy helps to understand: borrowing $100 and then keeping them in a safe increases the contents of the safe, not the net wealth of $100. The country had external resources, but their presence on the balance sheet did not guarantee that they were acquired without consideration. This distinction explains why the apparent size of the reservations did not protect applicants when restitution requests multiplied.
7. Debt and savings: currency effects of balance sheets
Talking about « general population debt » requires separating balance sheets. Public debt is an obligation of the State. Private credit belongs to households and enterprises which have contracted it. A bank’s liabilities to its depositors are not a personal debt of every citizen. And a central bank’s losses become a taxpayer’s debt only according to the treatment options chosen.
These balances are linked, but adding them together without consolidation produces double accounts. A bank that holds a government debt, financed by a deposit, does not create two independent public expenditure. On the other hand, if the public debt loses its value, the bank can no longer fully serve the deposit with that asset. Risk is transmitted along the chain.
For a household, three variables are decisive: the currency of its income, that of its debt and the real terms of repayment. A loan in dollars may seem comfortable as long as the salary in books is converted to the same price. If the price changes sharply without revalorisation of wages, debt service absorbs a much larger portion of income.
Strictly educational example: a household receives £1.5 million per month and must pay $300. At 1,500, the term is £450,000, or 30 per cent of income. At 3,000, it is worth £900,000, or 60 per cent. This calculation assumes a debt payable in available dollars, without contractual change. It does not describe all the actual settlement arrangements in Lebanese banks after 2019.
The reverse effect exists. A debt fixed in pounds can become much lighter for a borrower whose income is paid in dollars. An appropriation of £150 million represents $100,000 to $1,500, but approximately $1,676 to 89,500. This arithmetic result does not take into account interest, deadlines or any dispute. It shows why inflation and depreciation do not strike all debtors in the same way.
The applicant is yet another case. He may have saved his whole life without having contracted personal debt and yet be subject to the crisis by freezing his funds or by repayment on unfavourable terms. To claim that « the population is too indebted » would erase this fundamental difference between those who borrowed, those who lent and those who only used banking services.
Theworld Bank fact sheet of October 2026sets public debt at 154% of GDP in 2018, 175.3 % in 2019 and 249 % in 2020, and 130.9% in 2025 and 125.3 % in its estimate for 2026. These ratios should be read with changes in nominal GDP, conversions and debt treatment. Their decline does not show that the State has repaid its commitments or recovered normal access to financing. The country still faces the flaw and the need to restructure.
The collective burden also includes services that are no longer funded. When a household has to replace a public benefit with a private expense, its budget bears an additional constraint even without a new loan contract. It is useful to talk about the social cost of debt and losses, but not to turn all these expenditures into a fictitious financial stock allocated to each inhabitant.
For public debt, the conversion effect can be isolated by identity:debt ratio = (debt in pounds + rate LL/USD × debt in dollars) / nominal GDP in pounds. In unchanged terms and GDP, an increase in the price of the dollar increases the burden of foreign currency debt. If, in a simulation, 70 per cent of the initial debt is in dollars and 30 per cent in pounds, a doubling of the dollar increases the total value in pounds by 70 per cent, before any adjustment of prices, GDP or contracts.
Over the longer term, inflation can increase nominal GDP in pounds and reduce this ratio, while debt in dollars and its maturities remain due. The stock ratio and the ability to make current payments can therefore change. This is why the decline in a ratio after depreciation is not sufficient evidence of economic deleveraging.
8. Bank debt and access to credit
After a crisis, an outstanding loan may decrease because borrowers repay. It may also fall as a result of discounted settlement, conversions, recognised losses or valuation effects. If banks stop lending at the same time, the stock declines without a healthy recovery in the economy.
In itspresentation of 2024 developmentsThe BDL reported a bank loan portfolio of $5.5 billion at the end of December, with customer deposits of $88 billion. In particular, it linked this contraction to early repayments and credit settlements. These figures are not a survey of the debt of all households, and their accounting conversion requires caution.
A household that balances a credit by selling an asset, mobilizing a family transfer or using a locked deposit reduces its liabilities. However, it can lose its precautionary savings. A company that extinguishes its debts but can no longer obtain funds to buy a machine will defuse itself while reducing its ability to produce.
The disappearance of credit also changes the conditions for access to housing and activity. Anyone who already owns dollars can buy or invest. A person with a regular income but without initial capital is no longer necessarily financed. The crisis therefore favours liquidity holders at the expense of those who relied on their future income to finance a present project.
Nor are informal debts captured solely by the bank balance sheet: family advances, rent arrears, medical bills or supplier credits can take over. Without a recent and representative survey, they cannot be allocated a specific national amount. It can only be said that the decline in bank credit alone does not measure the financial relief of households.
TheWorld Bank, in its 2024 poverty assessmentAccording to 2022, income poverty was 44 per cent in the survey areas and 33 per cent among the Lebanese nationals surveyed. This is a pre-shock finding of 2024 and 2026, not a poverty rate measured today. However, it recalls that the cancellation of certain nominal debts coexisted with massive impoverishment.
9. The 2019-2020 test: Has the depreciation revived exports?
Box 3 ofLebanon Economic Monitor Spring 2025examine the actual effective rate and trade in goods until the end of 2024. The World Bank uses the banknote market rate from September 2019 rather than the old official rate. It notes a sharp fall in the real rate at the beginning of the crisis, with no corresponding increase in exports. The amounts of property retained in this study are as follows.
| Trade in goods, billions of dollars | 2019 | 2020 | Calculated change |
|---|---|---|---|
| Imports | 16.1 | 9.8 | -39.1 per cent |
| Exports | 3.8 | 2.9 | -23.7% |
| Commercial deficit of goods | 12.3 | 6.9 | -43.9% |
The improvement of 5.4 billion in the trade balance therefore comes from 6.3 billion fewer imports, reduced by 0.9 billion lost exports. It does not result from an expansion of sales abroad. The fact is important: the decline in the deficit and the recovery of the exporting apparatus are not equivalent phenomena.
However, this comparison does not isolate a causal effect of the exchange rate. The same years include a banking crisis, payment restrictions, a recession, the pandemic and the explosion of the port of Beirut. Flows are expressed in value: they mix quantities, prices and composition of products. Thus, the change in exports cannot be divided by the change in exchange rates to obtain a usable elasticity.
The result, on the other hand, is to reject a proposal that is too strong: a real depreciation alone does not guarantee an immediate increase in exports. A company can benefit from a reduced salary cost in dollars and remain unable to finance a stock, supply energy or deliver to its customers. The exchange acts on a relative price; it does not remove the constraints of quantity and financing.
To assess what an adjustment would have produced before 2019, a counterfactual scenario would have to be built that would include price indexation, dollar debt, access to credit and partner response. The available data do not suggest that a change to 3,000 would have avoided all losses. They explain why maintaining the course and an unprepared adjustment each had different costs.
10. Compare 2018 and 2026 diets
Between 1,507.5 and 89,500, the dollar price was multiplied by approximately 59.4. The dollar value of a pound therefore decreased by about 98.3%. This calculation does not measure cumulative inflation or the loss of purchasing power of each household. Income, prices and assets have adjusted at different rates.
Comparison of schemes requires further indicators. The following table uses the same vintage ofWorld Bank, October 2026. 2026 data remain annual estimates/projections.
| Indicator | 2018 | 2025 | 2026 estimated |
|---|---|---|---|
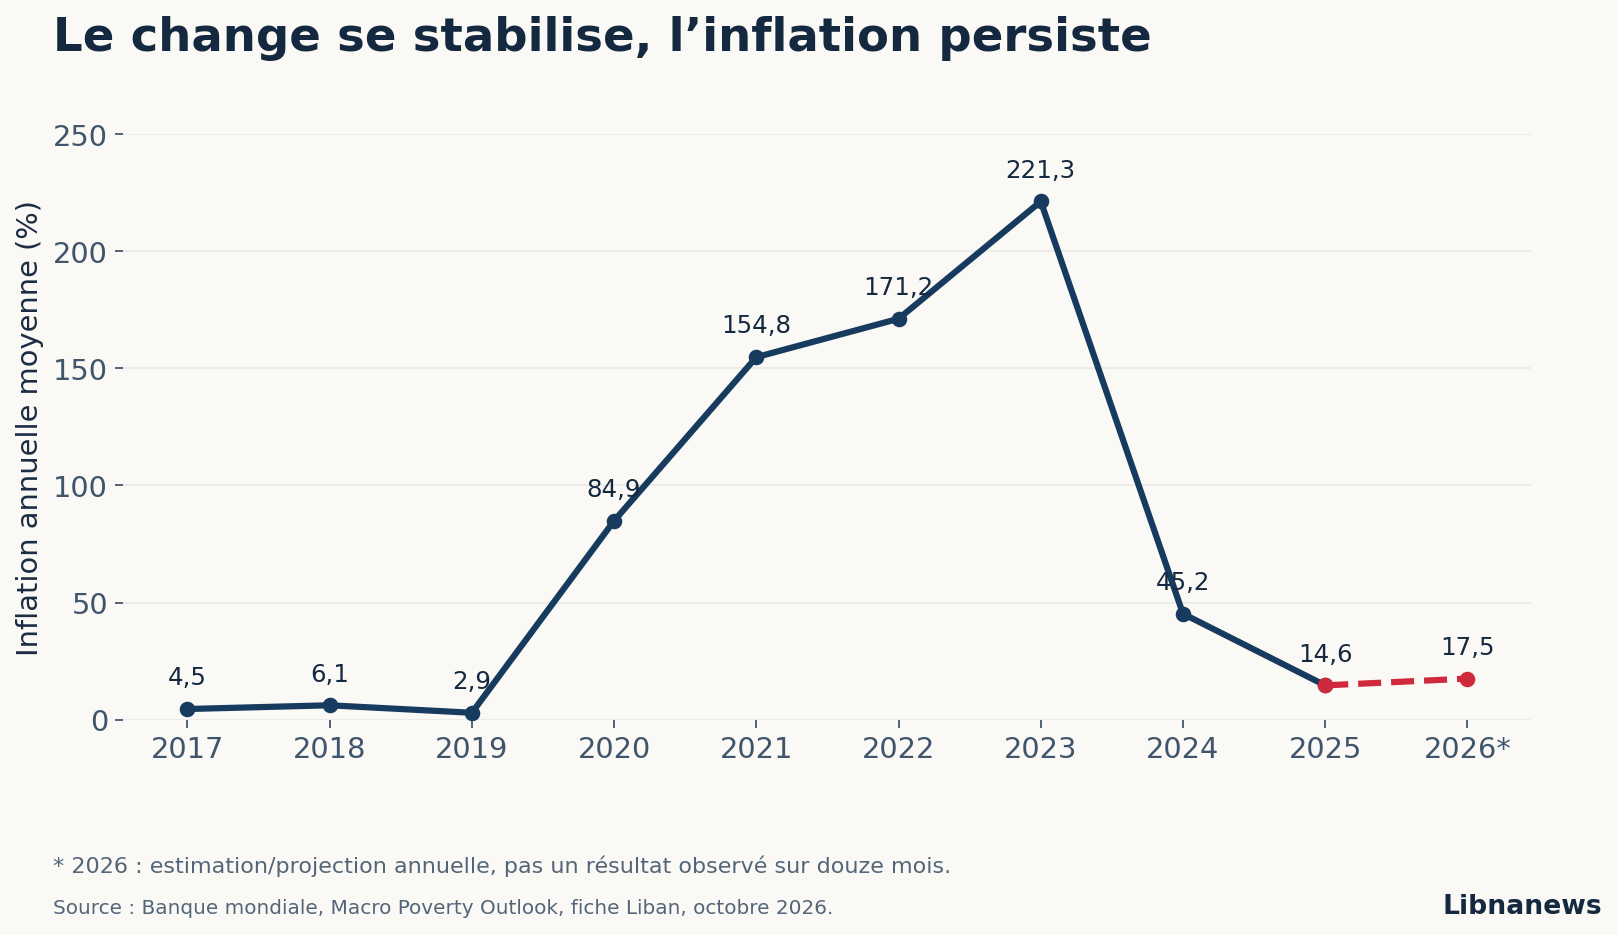
| Average annual inflation | 6.1 per cent | 14.6% | 17.5% |
| Budgetary balance / GDP | -10.9% | +3.9 % | +1.3 % |
| Current balance / GDP | -24.2 per cent | -25.1 per cent | -21.3 per cent |
| Public debt/GDP | 154.0 % | 130.9% | 125,3 % |
| Nominal GDP, billions of dollars | 55.29 | 36.88 | 38.96 |
The persistence of a high current account deficit brings the periods closer. The shift from a budget deficit to a surplus distinguishes them. TheIMF, March 2025, linked the stabilization to the cessation of monetary financing and foreign exchange subsidies, as well as the improvement of the budgetary balance since mid-2023. The current price is therefore not maintained in a budget configuration identical to that of 2018.
However, a cash surplus does not amount to a complete restoration of solvency. It should be read with outstanding debt payments, compressed expenditures, possible arrears and reconstruction needs. Similarly, higher nominal GDP in dollars can mechanically reduce debt ratios while real output declines. The 2026 indicator combines precisely a higher nominal GDP and a projected real contraction.
Dollarization also changes transmission. Before the crisis, many contracts seemed convertible to a stable price. Today, prices and part of revenues are directly or indirectly fixed in dollars, while old deposits remain subject to special conditions. The stability of the price of the species therefore does not establish the convertibility of these deposits.
Thebank Audi’s third quarter report 2026places the parallel market around 89,600 to 89,700 over the first nine months. The difference with 89 500 is less than 0.3%. This convergence indicates a low premium between two current exchange prices ; it does not measure the gap at a medium-term equilibrium.
11. The current channel: domestic inflation and real appreciation
At a fixed nominal rate, an increase in the price in books becomes an equivalent increase in dollars. A service billed 8.95 million pounds is worth $100 to 89,500. If it goes up to 10.74 million, it’s worth 120 dollars. The rate did not change, but the converted cost increased by 20%.
The transition to competitiveness requires an external comparison. In the convention where an increase means an appreciation, the bilateral relative price indicator is proportional to thelebanese price / (LL/USD × foreign price in dollars). In logarithmic variation, it evolves approximately as Lebanese inflation minus foreign inflation minus the increase in the number of pounds per dollar. For an effective index, partners and their currencies must be aggregated.
This channel is already documented for a recent period: the analysis of the World Bank in Spring 2025 shows a real appreciation after the stabilization of August 2023 and notes a 42% rise in domestic prices between September 2023 and December 2024. However, it does not provide a nominal equilibrium rate to be applied in November 2026. The study establishes relative price dynamics, not the exact level of current misalignment.
The difference is decisive. An index can go up after a collapse without exceeding its balance. This balance can also move with productivity, terms of trade, transfers or destruction of capital. The rise in an index and its overvaluation are not synonymous.
The October 2026 sheet contains another series, entitled « Real exchange rate index », 2015 base: 100.3 in 2024, 103.8 in 2025 and 102.2 in the 2026 estimate. It does not detail in this sheet the weights and deflators necessary to reconcile it with the TCER of the 2025 study. This series cannot therefore be connected to the previous ones or be used to mechanically confirm the simulation below. Its evolution recalls that high Lebanese inflation is not enough to calculate a multilateral index.
For the enterprise, the relevant cost may also differ from the consumption index: energy, transport, credit and inputs do not have the same weight in household expenditure and production costs. A comprehensive competitiveness analysis combines aggregate indices with sectoral unit costs and sales volumes.
12. Simulation: relative inflation, exchange and productivity
Suppose the average price level of 2024 is 100. With 14.6% of inflation in 2025, it rose to 114.6. Applying the 17.5% projection for 2026, it reached 134.655. The compound calculation therefore gives an increase of approximately 34.7% over the two years. Simply adding 14.6 and 17.5 would underestimate this progression.
Suppose now, only for the demonstration, that foreign prices increase by 3 per cent per year and that partner currencies remain fixed against the dollar. Their index rose from 100 to 106.09. With a nominal rate unchanged, the ratio of Lebanese prices to foreign prices increases by 134.655 / 106.09 – 1, or about 26.9 per cent.
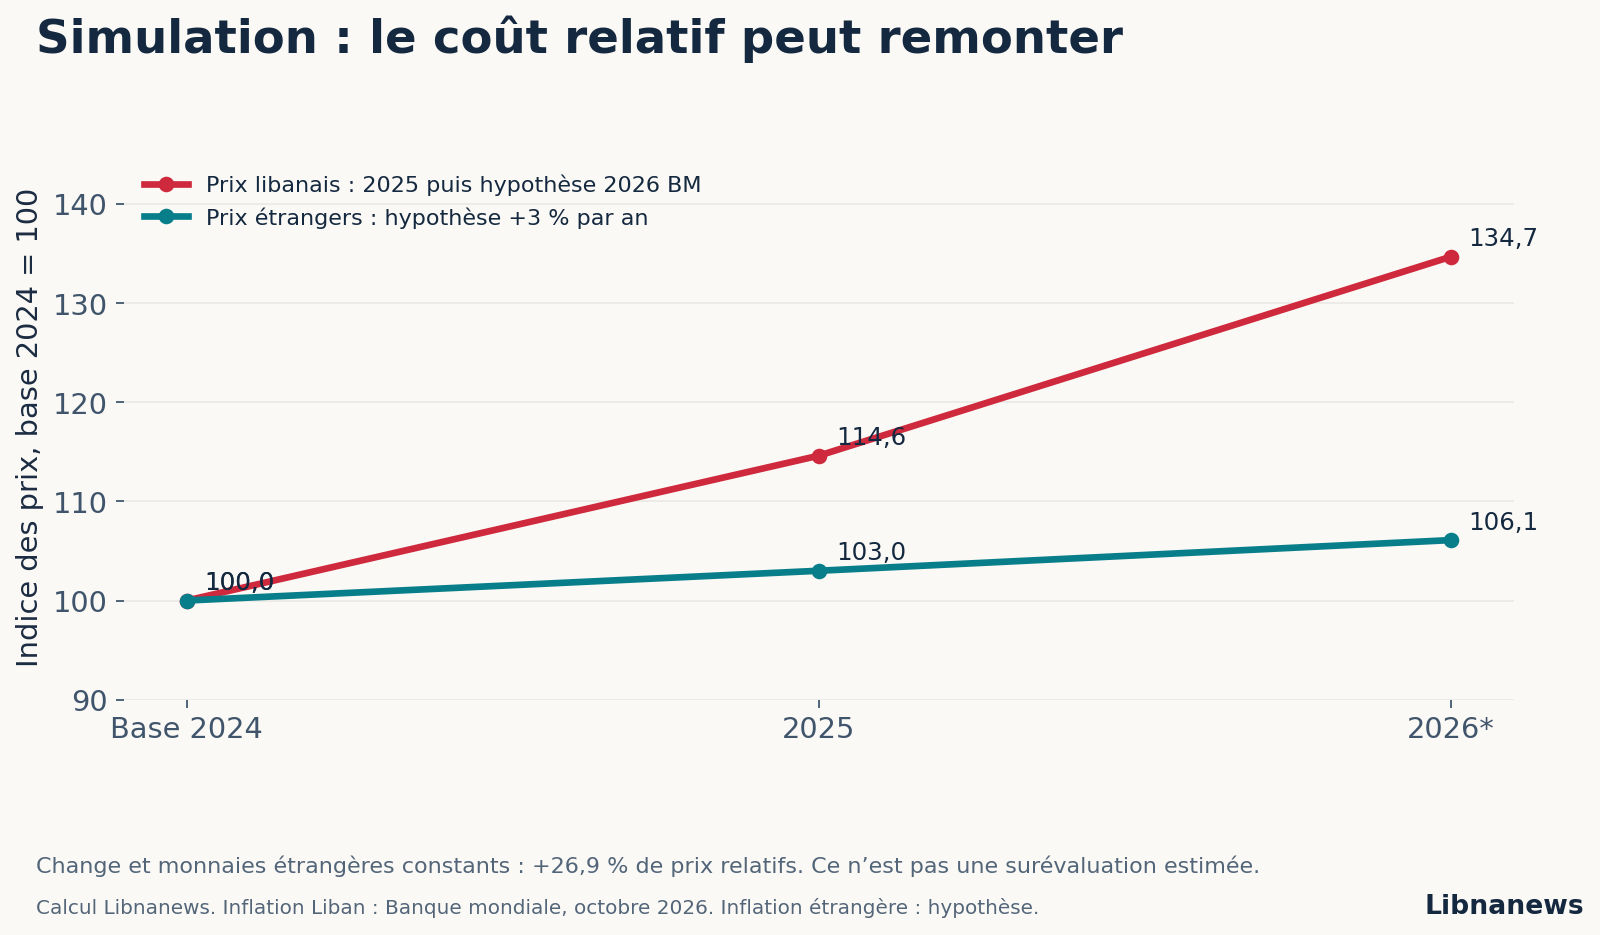
This 26.9 per cent is not an estimate of book overvaluation.The starting point may be overvalued, undervalued or close to balance. Productivity, trade, transfers and partner currencies can change. The value of 3% abroad is a hypothesis, not an observation on a Lebanese shopping basket.
Open the calculation: what would another foreign inflation change?
| Assumption of annual increase in foreign prices | Foreign index after two years | Relative increase in Lebanese prices |
|---|---|---|
| 0 % | 100.00 | 34.7% |
| 3 % | 106,09 | 26.9 % |
| 5 % | 110.25 | 22.1% |
Calculations Libnanews. Common base 2024 = 100; Lebanese inflation 2025 of 14.6% and projection 2026 of 17.5%; nominal rate unchanged. Relative variation is neither a equilibrium rate nor a recommendation for devaluation.
In a largely dollarized economy, changing the pound-dollar rate is not necessarily enough to lower costs in dollars. If rents, suppliers and part of wages are already indexed, they adjust with depreciation. In this case, the income remained in books. Competitive gain can be limited and social cost high.
We can test the sensitivity to change with the same hypothetical basket. If the price of the dollar increases by 10 per cent instead of remaining fixed, and if domestic prices do not react to this depreciation, the relative price increase is reduced from 26.9 per cent to 15.4 per cent. With a 20 per cent increase in the dollar, it falls to 5.8 per cent. These results come from 1,2693 / 1,10 – 1, and 1,2693 / 1,20 – 1, respectively.
The assumption of unchanged domestic prices after the change is restrictive. In a highly dollarized economy, their reindexation reduces the gain. In order to analyse cost competitiveness rather than the consumption basket, productivity must also be measured: at the same total wage cost, a 10% higher output reduces the unit wage cost by 9.1%. This provides another adjustment channel, but does not mean that such a gain would already be available in Lebanon.
These simulations separate three variables often grouped under the word « change »: nominal price, cost indexation and quantity produced per unit cost. They do not establish a target course. They show what assumptions would be necessary for a change in the price to effectively improve competitiveness.
13. Reserves in 2026: what is measured by the decline observed
According toeconomic research service of Crédit Libanese, taking over the BDL’s balance sheet on 4 November 2026, foreign currency reserve assets reached approximately $11.47 billion at the end of October. The decline since the beginning of the year is 429.87 million, or about 3.6% of the level at the end of 2025. On the contrary, the second half of October saw a small increase.
This net change does not measure the only interventions to defend the price. It results from foreign currency inflows and outflows, including payments and operations of the central bank. In order to allocate a precise share to the maintenance of 89 500, a comprehensive table of flows would be required, excluding valuation effects and reclassifications. The overall level does not provide this decomposition.
The current stock also remains above that of early August 2023. It is therefore possible to observe simultaneously a recovery over several years and a net consumption in 2026. These two observations correspond to different horizons; none should replace the other.
Theserial notice reproduced by BRITErecalls that the BDL has revised the classification to non-resident and liquid reserve assets. They do not constitute net reserves of all commitments. In addition, there are no interchangeable claims and resources that can be used for payment.
A stock close to 11.47 billion can therefore not be divided without caution by a recent rate of decline to announce a date of exhaustion. Needs change with tourism, transfers, imports, public payments and expectations. An acceleration of outputs can change the trajectory; additional entries can stabilize it.
The observed decrease is an indicator of pressure to explain. It does not establish the extent of any overvaluation or the imminence of a rupture. A stronger conclusion would require a projection of flows and commitments, with several scenarios, and not an extrapolation of the accounting balance alone.
14. War and reconstruction: separate effects on foreign exchange supply and demand
TheWorld Bank, August 2026, estimated growth from 2025 to 4.2% and forecast a real contraction of 6.4% in 2026, with an inflation rate of 17.5%. The conflict affects several variables at the same time, making an explanation based solely on the exchange rate insufficient.
On the foreign exchange supply side, the decline in tourism revenues or exports reduces the dollars earned. On the demand side, the recession can reduce purchases of goods, while energy, transport and reconstruction increase some needs. The balance depends on the amounts and timing of each of these flows.
Capital destruction also alters future production capacity. Two companies may experience the same exchange rate change, but react differently if one still has its equipment and the other has to rebuild them. The price adjustment does not replace the financing of this capacity reduction.
Financing for reconstruction is therefore essential. An external gift finances an import without creating the same future obligation as a loan. A long and concessional loan differs from a short commitment. An expenditure financed by book creation adds another channel: it can increase the demand for foreign currency if beneficiaries convert these books or buy imported goods.
TheIMF September 2026acknowledged the maintenance of stability through prudent policies, while noting the effects of the conflict and double-digit inflation. The observed stability and degradation of productive capacity are not contradictory: they cover different dimensions and may coexist for some time.
15. Three scenarios to test the sustainability of 89 500
The data allow for the construction of conditional scenarios, without assigning them a probability that the observations do not justify. The common criterion is the ability to finance external needs while avoiding persistent deterioration of production and balance sheets.
| Scenario | Dominant mechanism | Observations which would reinforce it | Observations that would weaken it |
|---|---|---|---|
| Stabilization compatible with recovery | Costs converge, productivity and external revenues increase. | Higher volume exports, reconstituted liquid reserves without disproportionate new commitments, productive credit in recovery. | Sustainable increase in unit costs without improved supply; shorter or more expensive external financing. |
| Real appreciation compensated by internal compression | Relative costs rise; low demand and liquidity restrictions maintain the price. | Price in rising dollars, low investment and credit, compressed real income despite a calm exchange market. | Measured productivity gains and expansion of external sales sufficient to absorb costs. |
| External financing shock | Foreign currency inflows are declining faster than demand adjusts. | Acceleration of net foreign exchange sales, comparable decrease in liquid assets, continuing increase in foreign exchange premium. | Recovery of income and long-term contributions, stabilization of reserves at constant scope. |
The first scenario does not necessarily require a different nominal course. An improvement in productivity or energy costs can change relative prices without depreciation. The second can maintain the same course for a long time, but with an active and income cost. In the third, tension can accelerate even if domestic prices have not increased recently: the initial shock comes from financing.
To distinguish these scenarios, the series must be comparable. Exports must be examined in terms of volume and product, reserves with constant scope, and financing according to maturity. Budgetary balances should be reconciled with deferred expenditures and debt servicing. Without these details, a favourable indicator may mask the transfer of a constraint to another part of the economy.
The comparison with 2019 becomes verifiable. There would be a repetition of the previous mechanism if a continuing real appreciation, a poorly funded external need and an accumulation of fragile commitments were again compensated by costly interventions. The mere presence of a stable course is not sufficient to establish this combination.
16. Results of the analysis
The pre-crisis misalignment is documented, its translation into 3,000 LL/USD is not in the identified studies.The IMF results depend on the external method and target. They cannot be converted into a precise nominal price without additional assumptions about prices and their reaction.
The rate affects competitiveness through non-indexed costs and relative prices.Sector calculations show that the same depreciation can produce a large, small or zero gain depending on the share of already dollarized expenditure. Trade in 2019-2020 confirms that price improvement does not guarantee export expansion when supply and financing are forced.
External financing and balance sheets pass the risk to the rest of the economy.The current account deficit is lower in dollars than in 2018 but remains high relative to GDP. The decline in reserves in 2026 is measurable, without allowing the whole movement to be attributed to the defense of the course. The effects on households vary according to the currency of income, debt and savings: the actual cancellation of a credit in pounds may coexist with the loss of a deposit or the disappearance of the new credit.
At 89 500, the channel of a new real appreciation exists, but identity with 2018 is not established.Budgetary discipline and the cessation of monetary financing are observable differences. Persistent inflation, productive constraints and foreign exchange needs are at risk. Their combination, rather than the number displayed at the counter, determines whether the rate accompanies a sustainable stabilization or defers an adjustment.





Comments