

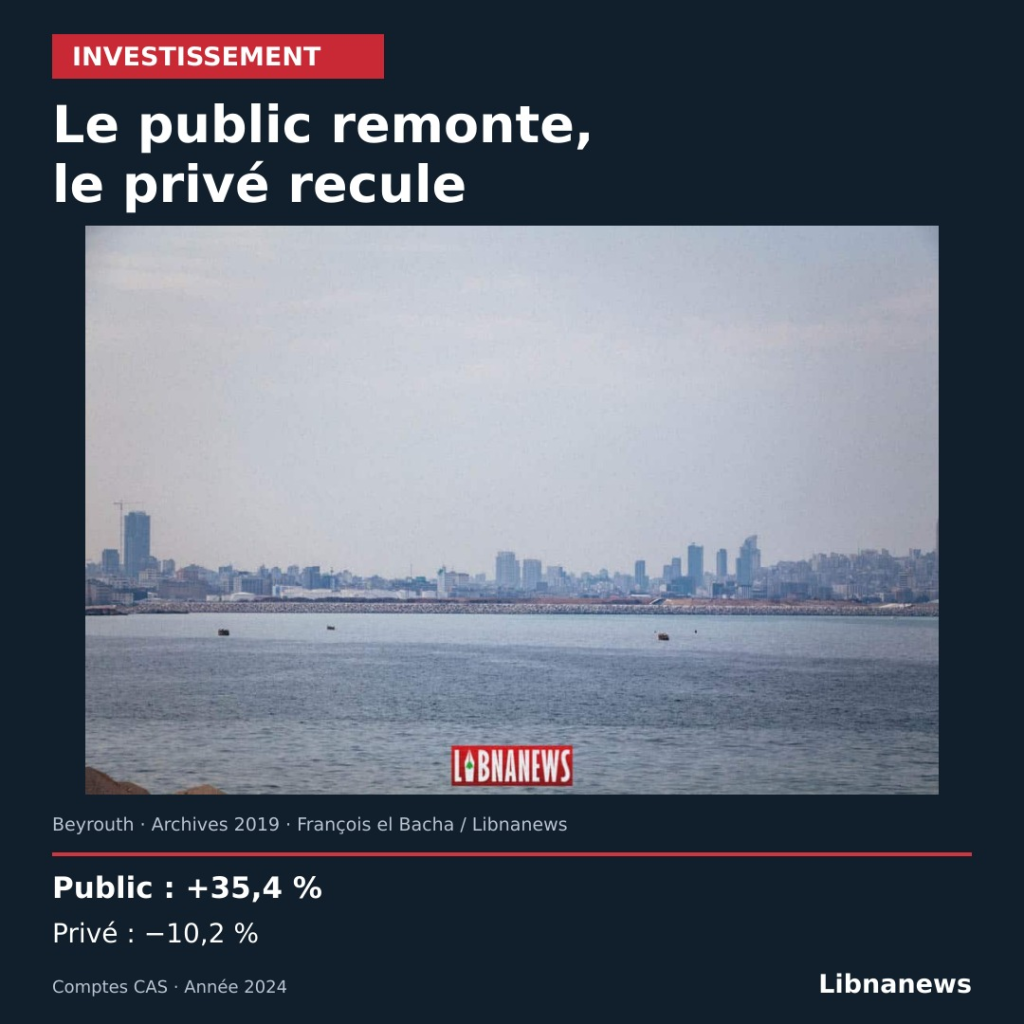
Public and private investment followed two opposing directions in Lebanon in 2024. The revised accounts of the Central Statistical Office (CAS) show a 35.4 per cent increase in the volume of public fixed capital compared with a 10.2 per cent decrease in the private sector. The public rebound did not offset the private decline: gross fixed capital formation decreased by 4.1%.
These rates are recalculated on the basis of the amounts in Table CAS, which presents them in rounded form. They concern the year 2024. They do not describe the investments announced in 2026 or the current state of progress in the construction projects. The distinction is important in a country where a pledge of funding, a budgetary commitment and an expenditure actually recorded can occur at different times.
Public and private investment: the weight of the amounts
At current prices, private fixed investment reached £346,989 billion in 2024, compared with £365,179 billion in 2023. It therefore falls by 5.0% in value. Over the same period, the public increased from £56,146 billion to £80,450 billion, an increase of 43.3%. Overall, there is a slight increase in value, from 421 325 to 427 439 billion pounds.
Price correction changes reading. At 2023 prices, the private amount of 2024 is more than £327,879 billion. The public reached 76,019 billion. Their total was 403,898 billion, lower than in the previous year. The nominal increase of 1.5% of the total therefore coexists with a real contraction of 4.1%.
| Fixed capital formation | LL 2023 billion | LL 2024 billion | Change in volume |
|---|---|---|---|
| Private | 365 179 | 346 989 | -10.2 per cent |
| Public | 56 146 | 80 450 | +35,4 % |
| Total | 421 325 | 427 439 | -4.1 per cent |
The private sector remains largely the majority. It accounts for 81.2% of fixed capital formation at current prices in 2024, compared with 86.7% in 2023. The public share increased from 13.3% to 18.8%. A rapid progression of the smallest set is therefore not necessarily sufficient to offset a more moderate decline of the largest.
The public cushions the decline without removing it
The table of contributions to GDP measures this effect. The decline in private fixed investment takes away about 1.7 percentage points from the 2024 growth. The public increase brings about 0.9 points. The balance of fixed capital formation thus represents a negative contribution of about 0.8 points.
A point contribution is not confused with the growth rate of a post. The 35,4 % increase in public expenditure describes the evolution of this investment alone. The 0.9 points indicate its accounting effect on the change in total GDP, taking into account its weight. Add directly -10.2% and +35.4% does not produce the growth rate of total investment.
Nor does these contributions demonstrate a given multiplier effect on enterprises or employment. They describe an accounting breakdown. Assessing the benefits of a public program requires knowing its beneficiaries, local or imported purchases, schedule and activities that it makes possible.
The 2019 benchmark shows very different trajectories
The volume indices, with 2019 set at 100, put annual variations in perspective. In 2024, the private fixed investment index reached 72, compared to 81 in 2023. The public figure is 141, compared to 104. The total is 80. These published indices are rounded and should not be used to recalculate the precise annual rates.
Public development is particularly affected. The index rose from 96 in 2020 to 7 in 2021, then rose to 57 in 2022 and 104 in 2023. The level of 2024 exceeds that of 2019, but this comparison does not mean that all infrastructure has regained its initial capacity. An annual investment flow does not measure the value or condition of all existing equipment.
The private man follows another path. Its index dropped to 30 in 2020, from 67 in 2021 to 99 in 2022. He then retreated for two years. The 2024 result is therefore clearly below the reference level, despite the catch-up observed after the initial shock.
What fixed capital covers
Gross fixed capital formation corresponds to the acquisitions, minus disposals, of assets produced sustainably used in production. It can include buildings, machinery and equipment. The term « gross » means that consumption of fixed capital, i.e. the economic wear and tear of assets, is not reduced.
It does not measure stock or bond purchases. Nor is it reduced to construction. An investment in equipment can increase without visible building site. Conversely, an increase in the value of existing land or buildings does not automatically constitute new production.
The CAS distinguishes this measure from gross capital formation in the broader sense. In the 2024 tables, the latter also includes net acquisitions of valuables. It reached £603,777 billion, compared with £427,439 billion for fixed capital alone. Consolidating the two would artificially inflate the amount presented as a fixed productive investment.
A reading that does not designate any construction site
The share of fixed capital in nominal GDP reached about 15.7% in 2024, compared to 18.7% in 2023. This decrease is due to the comparative evolution of investment and GDP at current prices. It does not replace volume analysis, which shows directly the decline in the quantities invested.
The tables do not detail the public projects that explain the progress. They therefore do not allow the increase to be attributed to a specific road, plant or reconstruction operation. To move from national to performance evaluation, project implementation data and implementation dates are still needed.





Comments