

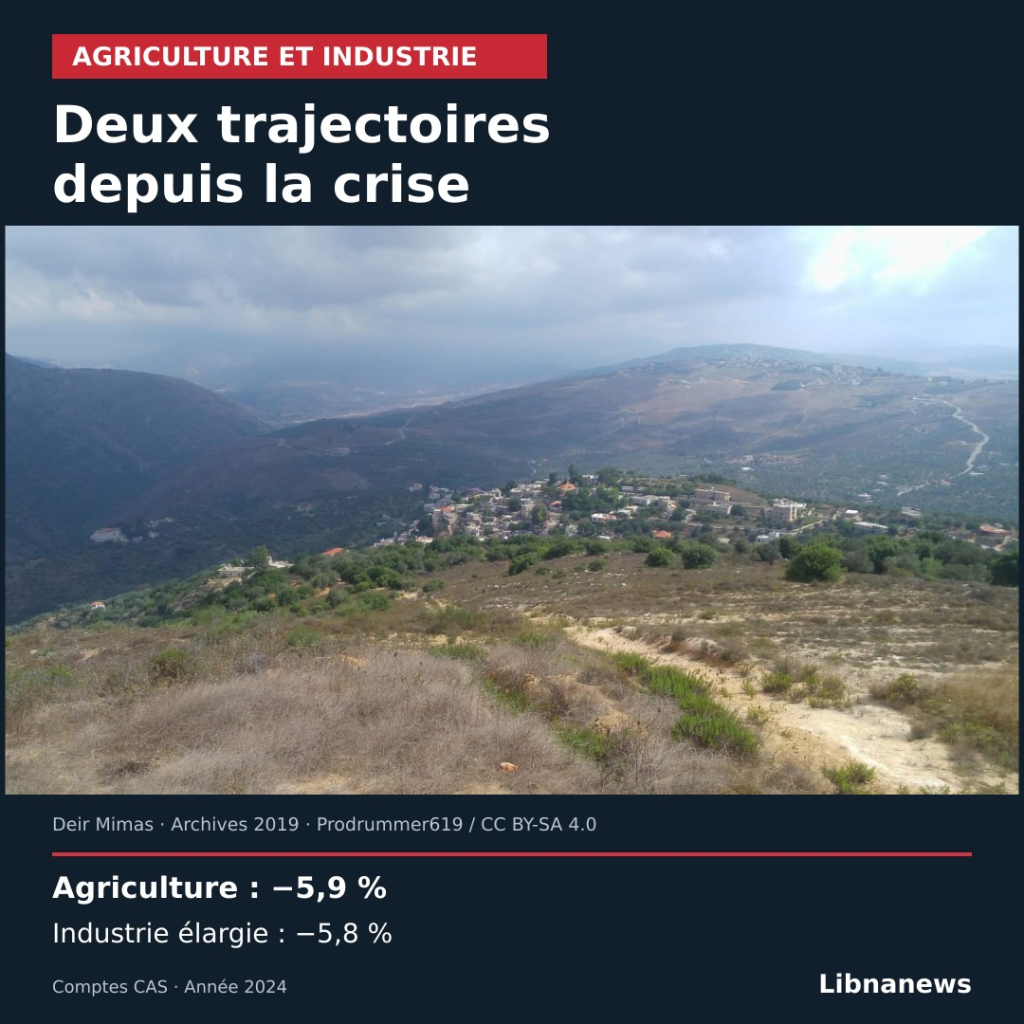
Lebanese agriculture and industry showed similar declines in 2024, but very different crisis trajectories. The revised accounts of the Central Statistical Office (CAS) show a real decline of 5.9% for agriculture in the broad sense and 5.8% for the mining, manufacturing and utilities aggregate. The first remains above its 2019 level. The second represents just over half.
These perimeters must remain visible. The agricultural sector includes livestock, forestry and fisheries. The extended industrial branch comprises several activities, including collective services. Its result cannot be presented as that of manufacturing plants alone. The tables do not give a decomposition to isolate each component.
Lebanese agriculture and industry: prices dampen nominal decline
Agricultural value added reached 117,797 billion daily pounds in 2024, compared with 108,651 billion in 2023. It thus rose by 8.4% in value terms. At 2023 prices, however, it reached only 102 218 billion. The volume decrease was 5.9%, while the deflator increased by around 15.2%.
For all mining, manufacturing and utilities, value added rose from £419,940 to £465,368 billion. The nominal increase is 10.8%. The amount of 2024 at 2023 prices is limited to 395 633 billion, a real contraction of 5.8%. Its deflator increases by around 17.6%.
| Branch | Current value added 2024 | Nominal change | Change in volume |
|---|---|---|---|
| Agriculture, livestock, forestry and fisheries | LL 117 797 billion | +8.4 % | -5.9% |
| Mining, manufacturing and utilities | LL 465 368 billion | +10.8% | -5.8 per cent |
The contrast between value and volume is therefore found in both branches. An increase in book amounts is not sufficient to establish a productive expansion. Detailed rates are recalculated from the tables, while the CAS rounded the two actual decreases to 6%.
Agriculture remains ahead of 2019
At 2019 reference prices, agricultural value added reached £3 trillion in 2024, compared to £2,459 billion in 2019. It thus remains about 22% above its starting level. This comparison does not mean that each crop or region has grown in the same proportions.
The series increases during the first years of crisis: 2,746 billion in 2020, 2,966 billion in 2021 and 3,209 billion in 2022. In 2023 it fell to 3,189 billion, and in 2024 to 3,000 billion. The recent decline follows several years of increase in this statistical set.
The national table does not break down the results between cereals, fruit, vegetables, livestock and fisheries. It also does not directly measure the net income of an operator. Value added reduces intermediate consumption, but it still has to pay for labour and capital involved in activity.
The enlarged industrial branch remains very much in decline
The course of the other together is much more degraded. Its value added at reference prices reached £4,333 billion in 2024, compared to £7,964 billion in 2019. It represents about 54.4% of the previous level. The cumulative gap thus reached almost 45.6 per cent.
The main break appears in 2020, with a level of $4,989 billion. The series then increased to 4,997 billion in 2021, 4,523 billion in 2022 and 4,599 billion in 2023. The rebound of 2023 did not start a sustainable return to the 2019 level: the volume value fell again in 2024.
These amounts describe the production of added value, not the theoretical capacity of the installations. They do not give a rate of use of machines or the number of plants in operation. A capacity can exist without being fully utilized. Equipment can also be destroyed, moved or obsolete, without the tables distinguishing these situations.
Two different contributions to the contraction of GDP
The proximity of regression rates masks a difference in weight. In 2024, extended agriculture accounted for 4.6% of total value added at basic prices. Mining, manufacturing and utilities account for 18.3 per cent. The second set therefore weighs about four times as much to this extent.
The CAS estimates its contribution to GDP growth at -1.1 points, compared with -0.3 points for agriculture. Together, these two branches withdraw about 1.4 percentage points from the change in GDP, out of a total contraction of 5.2%. The published contributions are rounded.
A contribution is not a single proof of causality. It measures the place of a branch in the accounting breakdown of growth. In order to explain precisely its decline, information on inputs, energy, sales, exports and production interruptions would be required.
Neither aid balance nor self-sufficiency measures
The accounts do not allow an evaluation of a particular agricultural or industrial programme. They do not detail recipients, amounts paid or results per project. An aid announcement in 2026 cannot explain a variation already recorded for 2024.
Similarly, an increase in agricultural value added over 2019 is not enough to measure food self-sufficiency. This depends on products, consumption needs and external trade. An economy can produce more in some crops while remaining dependent on imports for other foods.
The dossier establishes two points: a joint decline in 2024 and a very unequal resistance since 2019. To assess current productive capacities, these accounts need to be supplemented by recent sectoral data on the physical volumes, employment and equipment actually mobilized.





Comments