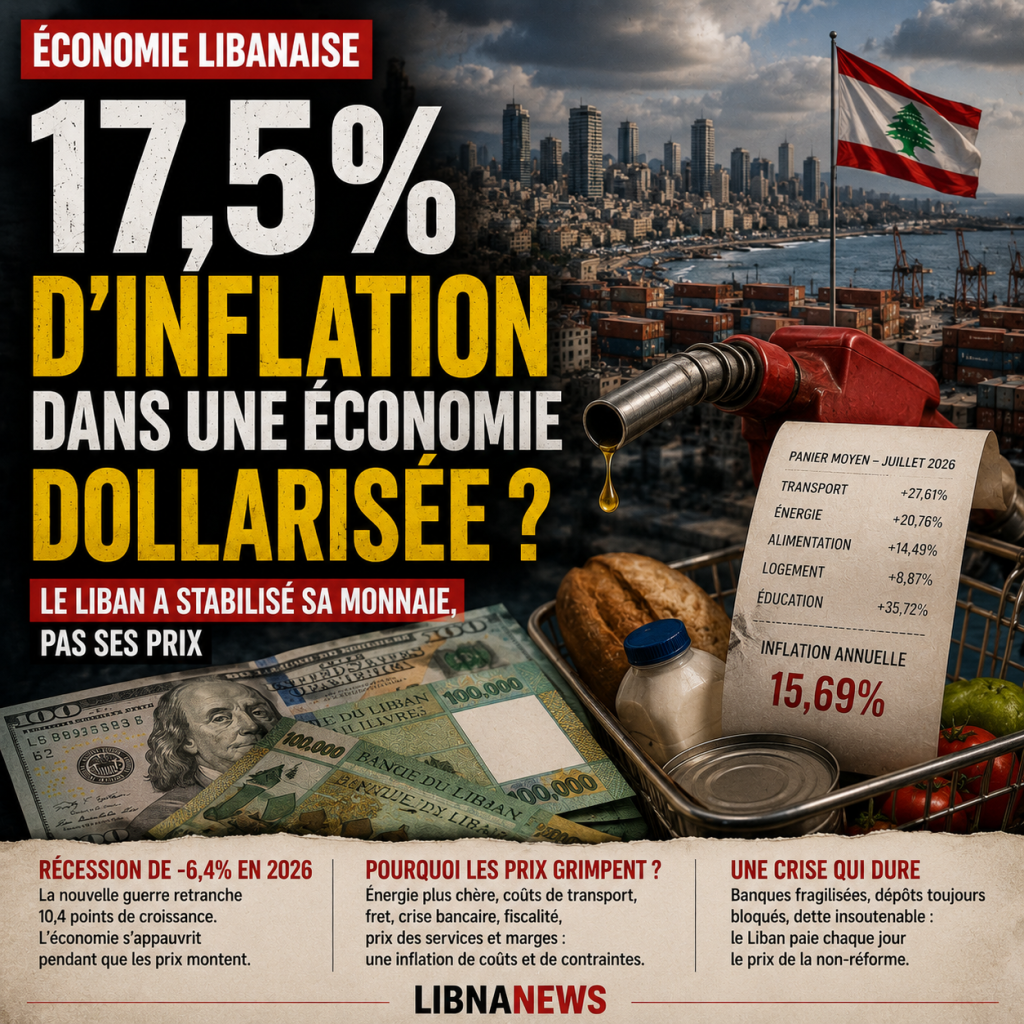
17.5% of inflation and 6.4% of recession: the lebanese paradox
The World Bank now forecasts an average inflation rate of 17.5 per cent for Lebanon in 2026 and a real GDP contraction of 6.4 per cent. Both numbers must be read together. They describe an economy that is not overheating but that is poor while becoming more expensive. After an estimated 4.2% growth in 2025, the fragile recovery was interrupted by the new war phase of 2026. According to the World Bank, the conflict would reduce 10.4 growth points to the scenario that would have prevailed in its absence.
The World Bank explicitly attributes inflation to supply chain disruptions, rising shipping costs and rising oil prices. At the same time, it stresses that the exchange rate has remained stable, supported by a more restrictive policy on liquidity in books and by the use of reserves. This juxtaposition is essential: unlike the period 2019-2023, inflation of 2026 can no longer be explained mainly by the collapse of the pound.
The 17.5% figure seems to be all the more dramatic as the economy has become widely dollarized. Many goods and services are directly displayed or implicitly calculated in dollars. A significant proportion of private wages are paid in fresh dollars. Rents, school fees, fees, hotels, restaurants and a large part of the business have returned to an American unit of account. In a normally dollarized economy, sustained exchange rate stabilization should gradually bring local inflation closer to international inflation.
This is not what happens. The Central Statistical Office measured annual inflation of 15.69 per cent in July 2026, after 17.25 per cent in June and 19.04 per cent in May. The World Bank’s forecast therefore extends an inflation already observed. The question is why an economy whose de facto currency is increasingly the dollar continues to experience such high inflation.
A dollarization that has stabilized the currency without normalizing the economy
Dollarization greatly reduces the exchange rate channel. When the pound collapsed, each imported product saw its price in pounds explode even when its price in dollars remained stable. Foreign exchange stabilization has neutralised the main part of this mechanism. The persistence of double-digit inflation thus indicates that its source has shifted: Lebanon has moved from mainly monetary and cambial inflation to inflation of costs, relative prices, taxation, financing and structural dysfunction.
Before the new war, the World Bank was still forecasting inflation at one in 2026. This counterfactual is precious. Even without the military shock, Lebanon would likely have maintained higher inflation than a normally functioning dollarized economy. Thus, a country-specific inflation premium already existed.
Panama or Ecuador show that using the dollar does not imply double-digit inflation. The currency can be the same while the cost of credit, taxation, energy, infrastructure, competition and political risk differ radically. Lebanon has dollarized without completely restructuring its banks, restoring a normal credit market, restructuring its sovereign debt and completing the normalization of public services. The currency has stabilized faster than the economy.
What the CPI basket says
The weights of the price index allow for a first accounting breakdown. Food and non-alcoholic beverages account for about 20% of the basket and increased by 14.49 % year-on-year in July. Their approximate contribution is 2.90 points. The housing occupied by its owner, weighted at 13.6%, increased by 8.87 per cent, or about 1.21.
Transport accounts for 13.1% of the basket and increased by 27.61 %, or about 3.62 points. Water, electricity, gas and other fuels weighed 11.8% and increased by 20.76%, or about 2.45 points. Education, weighted at 6.6%, jumped by 35.72 %, or 2.36 points.
These five items alone represent nearly 12.5 points out of the 15.69 inflation points observed. Transport, energy and food are particularly sensitive to oil, freight and war disruption. Education and housing further reveal internal mechanisms: salaries, rents, fixed costs, tariff catch-up and dollar adjustment.
War: major shock but incomplete explanation
The best way to assess the effect of the conflict is to compare scenarios before and after its worsening. Before the shock, inflation had to go back to 10%. It is now expected to reach 17.5%. Without claiming that all the difference is causally attributable to war, several additional points are clearly associated with the conflict and its consequences.
We must not naïvely add war, oil and freight. Oil, maritime insurance, logistical detours, ruptures and precautionary stocks are precisely the channels through which war is passed on to prices. We must reason in three blocks: normal international inflation; Lebanese structural inflation; extra war.
Energy, first multiplier
Lebanon is particularly vulnerable to energy prices because energy intervenes several times in the value chain. An increase in oil is increasing petrol but also road transport, deliveries, agriculture, construction and distribution. Diesel fuels private generators that are still massively complementary to public electricity. It is therefore part of the cost of a supermarket, restaurant, hotel, hospital, cold storage, factory and residential building.
Transport and the water, electricity, gas and fuel station together represent more than six points of accounting contribution to July inflation. It would be wrong to allocate these six points to oil alone, as they incorporate taxes, tariffs and margins. But they show why a direct and indirect contribution of several points is plausible.
Freight, insurance and inventory
For a highly importing country, the ex-works price is only part of the price in Lebanon. We must add freight, insurance, port charges, financing during transport, storage and distribution. War increases the cost of risk and can push importers to keep more stocks. The additional stock immobilizes capital and must be financed.
In times of uncertainty also appears pricing at replacement cost. A trader can integrate the anticipated cost of his next supply with the price of a product already on the shelf. If the next container is likely to be more expensive, the increase appears even before its arrival. This behaviour is rational individually but inflationary collectively.
The banking crisis: an invisible tax
The most underestimated structural factor is the banking crisis itself. Dollarization has stabilized the unit of account, but it has not restored the credit system.
In a normally banked economy, an importer finances his or her need for working capital, obtains a letter of credit and has commercial lines. In Lebanon, conditions are much heavier. Cash coverage can be very high and foreign correspondents include a country risk premium. A company may have to immobilize its own dollars long before the goods are sold.
This cost is not included in the CPI under a « bank crisis » line. It is incorporated at the cost price. Three months of 5% annual bank financing represents about 1.25% of the amount financed. Four months of own funds to which an undertaking allocates an opportunity cost of 15 % represent about 5 %. This example is not an estimate of the average Lebanese cost; it shows why the absence of normal credit can increase a product even when its international price is stable.
The delay in restructuring makes this structural phenomenon. A bank that does not normally lend does not finance inventory, equipment or investment. Companies are using their own funds more, looking for higher margins and less easily absorbing shocks. The banking crisis acts as a multiplier: it does not cause expensive oil or expensive freight, but it increases their transmission.
The problem was visible before 2019
The IMF documents for 2015 and 2016 show that the fragility was already visible. BDL’s gross reserves declined by 10.1% between May 2015 and May 2016. Faced with the slowdown in capital inflows, the Central Bank launched financial engineering operations in 2016 that raised gross reserves.
But this improvement had a counterpart. The IMF explicitly stated that the transaction had significantly reduced foreign currency liquidity held abroad by banks and increased BDL’s foreign currency liabilities.
The banks’ external liquidity rose from a peak of approximately $18 billion in June 2011 to $10.4 billion in May 2016, and to less than $8.5 billion at the end of August 2016. The IMF pointed out that this increased their dependence on the BDL for their foreign currency liquidity.
Financial engineering has thus improved the figure of the Central Bank’s gross reserves while degrading the autonomous liquidity of the banking system. Part of the cushion appearing in the BDL corresponded to dollars transferred by the banks.
Gross reserves and net reserves
A gross reserve is an asset. It does not say who has this asset economically or what commitments face it. If a bank transfers a billion dollars to the BDL, the Central Bank records an additional asset and simultaneously a debt to the bank. Looking only at assets gives the impression that reserves are increasing; consolidating the balance sheets shows that no new external assets have necessarily been created for the country.
The question of net reserves is therefore more important than that of gross reserves to analyse the solvency and liquidity of the system. The argument that the BDL’s net monetary position was already negative around 2015 must be based on a precise definition and homogeneous series. However, it is consistent with the IMF’s diagnosis of the contraction of net external assets and the growing dependency of the system on deposits.
The image of an intact minimum reserve box should be avoided. A bank’s accounting claim on the BDL does not imply that an identical amount of liquid dollars is still available in front.
Accounting demonstration: Net reserves were already negative in 2015
The most important point can now be established unconditionally. The adjusted financial position table published from the Alvarez & Marsal audit estimates the Bank of Lebanon’s net foreign exchange reserves at -5.5 billion dollars by the end of 2015. They rose to -14.7 billion in 2016, -25.3 billion in 2017, -35 billion in 2018, -59.7 billion in 2019 and -71.8 billion in 2020.
The difference between gross and net reserves is decisive here. In 2015, the BDL still has $35.8 billion in foreign currency reserves according to adjusted figures, but its foreign currency liabilities are already up to $41.3 billion. The gross stock is positive; the net position is negative.
Commitments to banks account for most of the imbalance. Bank deposits in BDL dollars reached $40.3 billion in 2015, $53 billion in 2016 and $83.7 billion in 2019. The Central Bank therefore retains visible external assets, but these have much larger dollar debts as a counterpart.
This demonstration corrects a reading that has long dominated the public debate: Lebanon did not have a net cushion equivalent to the gross reserves displayed in 2015. The system already had more claims on the BDL in dollars than on foreign exchange reserves available opposite.
Table — Adjusted BDL status according to the Alvarez & Marsal audit
| Year | Reserves FX | Commitments FX | Net reserves | USD bank deposits at BDL | Adjusted own funds |
| 2015 | 35.8 | 41. 3 | -5.5 | 40.3 | -15.0 |
| 2016 | 39.4 | 54.1 | -14.7 | 53.0 | -23.9 |
| 2017 | 38.6 | 63.9 | -25.3 | 62.8 | -25.9 |
| 2018 | 33.1 | 68.1 | -35.0 | 67.1 | -33.4 |
| 2019 | 24.9 | 84.6 | -59.7 | 83.7 | -39.0 |
| 2020 | 18.4 | 90. 2 | -71.8 | 89.4 | – 51. 3 |
Amount in billions of dollars. The data are the adjusted figures reproduced in Toufic Gaspard’s analysis based on the Alvarez & Marsal report.
Source: adjusted table from the Alvarez & Marsal audit; Libnanews graphic.
Financial engineering has shifted liquidity rather than creating it
The IMF documents show that the financial engineering of 2016 raised BDL’s gross reserves, but at the price of a decline in banks’ autonomous external liquidity and an increase in the Central Bank’s foreign currency liabilities.
The banks’ external liquidity increased from approximately $18 billion in June 2011 to $10.4 billion in May 2016, and to less than $8.5 billion at the end of August 2016. In 2017, the IMF also found that most banks did not comply with the 100% foreign currency liquidity ratio when long-term deposits with BDL were excluded from high-quality liquid assets.
The IMF explained that government and BDL investments lacked liquidity in private markets. In 2019, he noted that operations since fall 2017 had attracted more than $24 billion from banks to the BDL in February 2019, while tightening monetary conditions and reducing private credit.
It was therefore not a creation of dollars for the consolidated system. Banks handed over currencies to the BDL and received highly remunerated claims in return. The individual balance sheet of the Central Bank appeared to be strengthened in gross terms; The free external liquidity of the banking sector was decreasing.
April 2026: Three definitions of reserves lead to three diagnoses
In April 2026, the BDL published $54.26 billion in external assets, including gold. Gold alone accounts for 42.71 billion. Liquid assets in non-gold currencies are only 11.38 billion, and the net liquid position of BDL’s direct external liabilities is around 9.53 billion.
At the same time, banks report approximately $75.98 billion in deposits with the Central Bank. The BDL’s liability series gives a slightly different perimeter, at 78.89 billion. In both cases, bank receivables far exceed gold-free liquid assets.
While 90% of bank deposits with the BDL are considered to be foreign currency liabilities, a large net position is around -58.84 billion. With a 100% assumption, it reached -66.44 billion. These are not official figures: they are sensitivity tests showing how much the conclusion depends on the treatment of bank liabilities.
Gold cannot be simply added to the available currencies to conclude that the BDL is liquid. It is a major asset, but its mobilization depends on legal and political constraints. Bank deposits are either due or restructuring liabilities of the system.
Table — Successive layers of the BDL’s external balance sheet, April 2026
| Aggregate | USD billion | Interpretation |
| External assets with gold | 54.26 | Maximum gross stock |
| Or | 42.71 | Assets, not like cash |
| FX liquid assets excluding gold | 11.38 | Published currencies and liquid securities |
| Less: external direct commitments | 1.84 | External liabilities |
| FX net liquid external liabilities | 9.53 | Close measure |
| Bank deposits at BDL | 75.98 | Bank accounting debt |
| Large position if 90% of deposits are FX | -58.84 | Sensitivity test |
| Large position if 100% of deposits are FX | -66.44 | Maximum test |
Sources: Bank of Lebanon, April 2026; calculations Libnanews.
Minimum reserves are not a separate safe
The 14% regulatory ratio provides another consistency test. Applied as a proxy to the $84.51 billion in foreign currency customer deposits recorded in banks in April, it would amount to $11.83 billion.
This amount is already $0.46 billion higher than the BDL’s gold-free liquid assets. After deduction of direct external commitments, the gap is around 2.30 billion.
This calculation is not a formal regulatory estimate: the exact basis excludes certain fee accounts and includes exemptions. It demonstrates, however, that the term « minimum reserves » cannot be understood as evidence that an intact envelope of $14 per cent of all deposits still exists outside the overall balance sheet of the BDL.
Table — 14 % ratio consistency test, April 2026
| Element | USD billion | Reading |
| Foreign currency customer deposits | 84.51 | Residents + non-residents |
| 14 % applied as a proxy | 11.83 | Indicative basis, exact non-regulatory |
| BDL liquid gold-free FX assets | 11.38 | Difference: -0.46 |
| Net liquid FX assets of external debt | 9.53 | Difference: -2.30 |
Banks’ own liquidity has become extremely weak
The April 2026 aggregate balance sheet shows $0.83 billion in cash and deposits with other non-resident central banks and $5.55 billion in non-resident financial sector claims. Gross external liquidity thus stands at 6.38 billion.
After deduction of 2.25 billion commitments to the non-resident financial sector, net liquidity fell to 4.13 billion, i.e. only 4.89 % of customer deposits in foreign currencies.
An indicative floor of 3% is already 2.54 billion. The remaining amount is only $1.59 billion before deposits, operational requirements, encumbered assets and off-balance sheet liabilities.
By contrast, banks’ deposits with the BDL amount to approximately 75.98 billion, or 89.90 per cent of customer deposits in foreign currency. The core of the bank balance sheet therefore remains a domestic debt on the Central Bank, not an independent external liquidity.
These aggregated figures are consistent with the idea that several large banks exhausted their free liquidity in early 2026. However, they do not make it possible to say that all Alpha banks are individually at zero: a bank-by-bank demonstration would require the deposits, encumbered assets, off-balance sheet liabilities and the operational buffer of each institution.
Table — Liquidity scale of commercial banks, April 2026
| Indicator | USD billion | % of FX deposits | Reading |
| Foreign currency customer deposits | 84.51 | 100,00 % | Basis for comparison |
| Narrow external liquidity gross | 6.38 | 7.55% | Cash other CB + financial claims NR |
| Narrow net external liquidity | 4.13 | 4.89 % | After financial liabilities NR |
| 3 % indicative floor | 2.54 | 3,00 % | Supervisory threshold used as proxy |
| Residue after floor | 1.59 | 1.89 % | Pre-fresh deposits and operational requirements |
| Deposits with BDL | 75.98 | 89.90 % | Domestic debt, non-independent liquidity |
| Net broad external position | -12.82 | -15.17 % | Includes non-resident client deposits as liabilities |
Figure — Independent external liquidity and deposits with BDL
Source: Consolidated balance sheet of commercial banks, April 2026; Libnanews calculations.
Letters of credit almost collapsed
In 2016, there were approximately $5.72 billion in documentary appropriations to finance imports. The appropriations used amounted to 5.31 billion and the stock in progress at the end of year 1.35 billion.
Between January and April 2026, the openings were only $16.14 million. Even mechanically annualized, the flow would only reach 48.42 million. The decrease from 2016 is 99.15%.
The annualised appropriations used decreased by 98.67%, and the stock of current appropriations, to 63.58 million in April 2026, was 95.30 % lower than at the end of 2016.
This result is one of the most direct indicators of the disappearance of traditional bank financing for foreign trade. Imports have not disappeared; their financing shifted to cash, equity, external guarantees or non-banking. The cost of the corresponding capital is incorporated into the prices.
Table — Documentary import credits: 2016 versus 2026
| Indicator | 2016 | 2026 | Back |
| Appropriation | USD 5717.4 MILLION | 48.4 M USD annualized | -99.15 % |
| Appropriations used | 5314.4 M USD | 70.5 M USD annualized | -98.67 % |
| Current appropriations | USD 1352.6 MILLION | USD 63.6 million in April | -95.30 % |
Sources: Bank of Lebanon, Quarterly Bulletin 2017-Q1 and monthly series of April 2026; Libnanews calculations.
Circulars 158 and 166: the interim system
This distinction is crucial to understand circulars 158 and 166. The Bank of Lebanon reports that these mechanisms now distribute more than $2.5 billion in cash per year to depositors. By the end of March 2026, $6.109 billion had been disbursed since their launch. The BDL provided $4.183 billion, or 68.46%, compared to $1.926 billion for commercial banks.
March is even more revealing. Of the $240.4 million distributed, banks provided only $28.36 million or 11.8 per cent. The BDL accounted for about 88.2% of the flow. The Central Bank officially presents these disbursements as financed, inter alia, by the banks’ compulsory foreign currency investments with the Bank.
Accountably, this explanation refers to a BDL debt to banks. Economically, it does not demonstrate that an equivalent stock of currencies has been kept intact. This is precisely the distinction between a debt on the Central Bank and a truly mobilizable external liquidity.
Circular 158, introduced as an exceptional mechanism for the progressive return of deposits, has been amended on numerous occasions. The interim has become one of the main crisis management architectures. This does not call into question the right of depositors to recover their funds: the dollars distributed correspond to their receivables. But the mechanism shows that the final resolution of the losses has not yet taken place.
Have banks exhausted their leveraged liquidity?
The fall in the contribution of banks raises a central question. If they only provide 11.8% of the monthly disbursements in March 2026, should it only be seen as the effect of the allocation rules or as a sign that their truly mobilizable external liquidity has become insufficient?
Historical data make this second hypothesis plausible. As early as 2016, the IMF noted that banks’ external liquidity had declined sharply. After 2019, institutions had to cope with withdrawals, contraction of their business and the constraints of circulars.
The assumption that the own liquidity available for withdrawals would have reached a limit at the beginning of 2026 must, however, be presented as the result of a balance sheet calculation, not as official data until all series are reconciled. The 11.8% figure is nevertheless a strong signal: marginal financing of repayments is now largely based on the BDL.
This leads to a fundamental question. If minimum reserves have been consumed economically over the years and banks no longer have sufficient external liquidity, what is the economic source of the dollars distributed today? The changes in BDL’s liquid assets, its purchases of foreign currency in the market, its revenues, other assets and movements in its balance sheet should be examined. A simple reference to minimum reserves does not answer this question.
Taxes: official wage justification and real financial constraint
In February 2026, the government announced a tax of £300,000 per can of 20 litres of gasoline and an increase of one point of VAT, from 11 to 12 per cent, as part of the financing of wage increases and public pensions. This is the official justification and must be reported as such.
But a macroeconomic analysis cannot stop with the announced political allocation. The budget, banking restructuring, deposit return and monetary policy are bound by the same resource constraint.
It would be excessive to write that VAT is legally assigned to Circular 158. Accounting circuits are separate. On the other hand, at the consolidated level, the State, the BDL and the banks belong to a financial architecture whose constraints are passed on. A state that is excluded from markets and wants to avoid monetary financing is pushed towards taxation. A BDL who wants to defend the exchange while financing massive withdrawals must preserve or acquire currencies. An unrestructured banking sector no longer normally provides credit.
The taxpayer can therefore pay several times the same crisis: as a depositor whose savings remain blocked; as a client of companies that pass on the cost of financing; as a taxpayer when the State increases the levies; and as a consumer when these levies are found in prices.
This reading also serves to mitigate the assertion that new taxes would simply fund salary increases. In a narrow budget accounting, they actually increase the resources of the State and can finance new expenditure. In a consolidated reading, they mainly help to maintain the balance of a public sector that can no longer use the same financing methods as before 2019, while the BDL simultaneously devotes considerable amounts of foreign exchange to withdrawal mechanisms.
The question is therefore not to seek a direct transfer between VAT and Circular 158. The overall allocation of scarce resources must be observed. If the state increases the levies in order to avoid a monetized deficit, while the BDL uses its foreign exchange capacity to support withdrawals and exchange rates, both policies belong to the same macroeconomic constraint.
Indirect taxation: an additional layer of inflation
A VAT increase directly affects the TTC price when it is passed on. A gas tax has a direct effect on the pump and an indirect effect via transport. Customs duties, administrative charges and public tariffs produce similar mechanisms.
The effect is cumulative. An imported product may experience an increase in freight, then a higher financing cost, then a charge or tax, and then an increase in local transportation. The trade margin applies on an already high priced basis and VAT is then applied. Relatively limited increases at each stage can produce a much more visible final increase.
Taxation probably cannot explain only several points of 17.5%, but a contribution of the order of one point, possibly more depending on the actual implementation of the measures and their transmission, is an order of magnitude to be tested. Above all, it intervenes in an already inflationary chain.
What new taxes can actually add to the CPI
The increase in VAT from 11 % to 12 % does not mechanically increase the final price by 1 %. For a property already taxed and whose non-tax price does not change, the change from 1.11 to 1.12 represents an increase of 0.90% in the TTC price.
If 60 to 75 % of the basket actually undergoes this increase and the transmission is complete, the direct effect on the CPI would be around 0.54 to 0.68 points. Indirect effects via business costs and margins may be added, but the direct tax channel is likely to remain below one point.
The government estimates that the additional VAT point would raise approximately $207,7 million per year, representing only 26.0% of the $800 million announced cost for salary increases. The official justification of wages does not therefore exhaust the question of financing.
The contrast with the circulars is striking: their annual rate exceeds $2.5 billion, at least 12.0 times the expected return from the VAT point. The only payments in March, 240.4 million, already exceed the annual estimate of the additional VAT revenue.
These comparisons do not prove that VAT is legally financing Circular 158. They show the scale of the consolidated constraint: the state takes more from consumption to limit its deficit, while the BDL mobilizes currencies of a much higher order of magnitude to maintain withdrawals and monetary stability.
Table — Fiscal measures and macroeconomic order of magnitude
| Calculation | Result | Interpretation |
| VAT effect 11 % → 12 % | 0.90% | Effect on already taxed property |
| Possible direct effect on CPI | 0.54–0.68 pt | Assumption 60–75 % coverage/pass-through |
| Additional annual VAT revenue | USD 207.7 MILLION | Government estimate reported |
| Announced cost of salary increases | USD 800 MILLION | VAT covers only around 26% |
| Information circular 158/166, annual pace | > USD 2.5 billion | > 12.0 times the VAT revenue |
| Payments of circulars in March | USD 240.4 MILLION | Over the estimated annual VAT revenue |
These calculations distinguish strictly between the official budgetary allocation and the consolidated State-BDL-bank analysis.
The deficit: distinguishing the deficit from its financing
A government deficit is not mechanically inflationary. It becomes particularly so when it is financed by monetary creation or when it weakens foreign exchange expectations.
The World Bank points out that public finances remained relatively strong in the first half of 2026 after an overall surplus of 3.9% of GDP in 2025, supported in particular by improved tax collection, customs and VAT. But it foresees increasing pressure in the second half of the year: humanitarian and reconstruction needs, public compensation and revenue slowdown.
Debt remains unsustainable and restructuring negotiations have not yet begun. Lebanon is therefore in an unusual situation: the State must finance more expenditure without having a normal debt market and without being able to return safely to massive monetisation.
If adjustment involves more indirect taxes, the inflationary effect is fiscal. If it goes through domestic debt, it can further drain private financing. If monetary creation were to come back, the risk on the pound and prices would be much greater. The deficit must therefore be analysed by its method of financing, not as an autonomous cause.
Replicating in dollars: inflation that the war does not explain
Education at +35.72% is one of the most revealing indices. A Lebanese school does not import 35% of American inflation. It adjusts its costs according to wages, rents, energy, investments and the need to rebuild a cost structure after several years of collapse.
The same phenomenon exists in rents, catering, recreation and many services. During the crisis, some revenues collapsed in dollars, some tariffs remained artificially low and some wages were partially re-paid. Foreign exchange stabilization did not stop this catching up.
Dollarization fixes the unit of account; it does not fix relative prices. If a salary, rent or tariff had dropped by 80% in dollars and then gradually recovers part of that loss, the CPI increases without any depreciation of the pound.
This is probably one of the main reasons why inflation would still have been high even without the war. The World Bank was already anticipating inflation in some domestic services, including housing and education, before the shock.
Margins and competition: the transmission coefficient
Finally, the initial increase in cost must be distinguished from the proportion of this increase transmitted to the consumer. In a highly competitive market, a company can temporarily absorb part of the shock by reducing its margin. In a market where all players are subject to the same constraints simultaneously, transmission is faster.
The Lebanese problem is therefore not necessarily an autonomous explosion of profits in each sector. It can be a particularly high pass-through coefficient. Oil, freight, banking and taxes are passed on quickly because companies have little financial capacity to absorb them.
The scarcity of credit exacerbates this phenomenon. A company that does not have a cash line must maintain liquidity. It can less easily accept several months of reduced margin in the hope that the shock will be temporary.
The consumer then becomes the final absorber of a succession of risk premiums.
First breakdown of 17.5%
No institution publishes an official breakdown of Lebanese inflation according to its causes. It would therefore be misleading to say that 1.7 points come exactly from banks or 2.3 points from freight. On the other hand, the data allow for the construction of ranges.
A first block of 2.5 to 3.5 points can be associated with international inflation and price movements that would have affected an economy using the dollar even without a Lebanese crisis.
A second block, potentially 5 to 7 points, corresponds to the Lebanese structural premium: reproducibility of services, banking malfunction, cost of capital, taxation, administered tariffs, energy inefficiency and high cost transmission.
The third block, of the order of 7 to 9 points in a counterfactual scenario, would correspond to the supplement directly or indirectly linked to the war: oil, freight, insurance, disturbance, stocks and risk premium. The boundaries overlap because the mechanisms interact; they shall not be mechanically added.
The robust conclusion is less precise but more important: the war probably explains a fraction close to half the inflation of 2026, but it does not explain why Lebanon already had abnormally high inflation before the shock.
A revised 17.5 point central scenario
The previous calculations make it possible to tighten the decomposition without pretending to achieve econometric identification. The war shock remains the main block, as it brings together energy, freight, insurance, ruptures, stocks and risk premium. The banking crisis is an autonomous channel: it explains why the external shock is transmitted more fully and why a product can become more expensive in dollars even if its world price varies little.
The central scenario attributes 2.8 points to the international base; 7.7 war shock points; 2.6 points to domestic repricing; 1.5 points at bank and financial cost; 0.8 points to taxation and administered prices; and 2.1 points at margins, energy inefficiencies, market structures and residual interactions.
The war would account for about 44 per cent of inflation, the international base 16 per cent, and the actual Lebanese malfunctions or adjustments about 40 per cent. Decimals should not be read as an official measure: this scenario is used to make the mechanisms identified compatible with the World Bank total.
Table — Indicative central scenario of 17.5%
| Block | Items | Share | Channels |
| International inflation | 2.8 | 16.0% | World prices and anchor currency |
| War: energy, freight, ruptures | 7.7 | 44.0% | Oil, insurance, inventory, risk |
| Domestic Repricing | 2.6 | 14.9% | Schools, rents, services and wages |
| Banking / financing crisis | 1.5 | 8.6 per cent | LC, cash collateral, working capital |
| Taxation / Administered prices | 0.8 | 4.6 per cent | VAT, fuel, duties and tariffs |
| Margins and interactions | 2.1 | 12.0% | Pass-through, generators, competition |
| Total | 17.5 | 100.0% | Analytical scenario, unofficial |
Libnanews calculations from the current World Bank counterfence, CPI and financial balance sheets.
The Lebanese inflation premium
Perhaps the most useful concept is the Lebanese inflation premium. It refers to the gap between what would be expected from an economy using a stable currency and actual inflation.
This premium does not correspond to a single tax or monopoly. It adds up electricity costs, cash financing of imports, credit paralysis, war risks, insurance, taxes, catching up services and low absorption capacity of companies.
It is in a way the daily price of non-normalization of the economy.
Lebanon managed to stabilize the exchange rate without resolving the accumulated losses in the financial system. He re-adopted the transactions without giving the banks back their intermediation function. It restored part of government revenue without restructuring the debt. It has restored certain rates without completely restoring the corresponding services.
Monetary stabilization has therefore stopped the most dramatic hemorrhage, but it has not removed the economic cost of the crisis.
Lebanese stagflation
The combination of -6.4 % growth and 17.5% inflation is more worrying than each of the two figures taken separately. It means that purchasing power is compressed at the very moment when activity, investment and income are weakened.
Demand inflation can accompany a dynamic economy. This is not the case here. Destruction and displacement reduce supply, tourism is affected, investment is delayed, import costs are rising and households are experiencing higher prices.
It is a stagflation of costs and supply constraints.
She’s hard to fight. A restrictive monetary policy can stabilise the pound but does not reduce the cost of freight or a letter of credit. Higher taxes can stabilize the budget but add inflation. An increase in public wages can restore purchasing power but increase financing needs. A faster distribution of deposits supports households but increases the need for foreign currency liquidity.
Each instrument therefore moves part of the cost without removing the underlying economic loss.
Why bank restructuring is also an anti-inflation policy
Bank restructuring is often presented as a separate record of inflation. It’s a mistake. Restoring creditable and lending banks would reduce the cost of working capital, letters of credit, the need to immobilize cash and the risk premium applied by foreign partners.
A functioning banking system would also allow companies to invest in energy efficiency. A company able to finance solar panels, better refrigeration or less energy-efficient equipment becomes less sensitive to oil. Credit can therefore indirectly reduce the transmission of energy shocks.
The restructuring would also make it possible to distinguish viable establishments from insolvent ones. As long as this separation is not complete, the whole system remains uncertain. This uncertainty has a price: depositors retain more cash, companies prefer liquidity, foreign correspondents demand more guarantees and banks lend little.
The inflationary cost of the banking crisis is therefore not only the cost of a letter of credit. This is the cost of an entire economy having to operate with much more equity and much less intermediation.
The return of deposits does not create the wealth that has disappeared
Circulars pose another conceptual problem. Making a depositor a dollar does not create a new dollar of wealth: it turns a blocked bank debt into usable liquidity.
From the applicant’s point of view, this is a restitution. From a macroeconomic point of view, however, this transformation can change demand. A dollar blocked in an inaccessible account hardly finances any consumption. The same dollar withdrawn in cash can be spent.
When more than $2.5 billion a year is returned to circulation, the effect on demand is not necessarily negligible in a small economy. However, an abusive conclusion must be avoided: depositors are not responsible for inflation and repayment of their claims is not a stimulus policy comparable to a monetary-funded fiscal distribution.
The effect depends on the source of the dollars. If BDL uses an existing external asset, it transforms its balance sheet composition and potentially reduces its cushion. If it buys dollars in the market for books, it withdraws currencies from the market while injecting books before they are sterilized. If it recycles new entries, the effect is different. Therefore, the analysis of circulars should be linked to the BDL balance sheet.
The role of reserves in foreign exchange stability
The World Bank stresses that the stability of the pound depends in particular on the use of reserves and more restrictive book liquidity. This stability is an important success compared to the previous collapse, but it has an opportunity cost.
Each dollar used to defend stability or finance a withdrawal is not available for any other use. This does not mean that the BDL should let the currency collapse or prevent withdrawals. This means that resources are scarce and their allocation needs to be explicitly analysed.
Moreover, exchange rate stability can mask inflation in dollars. This is precisely what happens when local prices rise while parity remains unchanged. The consumer paid in dollars then loses purchasing power without any depreciation of the currency he uses.
This phenomenon is particularly important in understanding the social situation. After 2019, much of the debate on purchasing power focused on the book. In 2026, a household paid in dollars can also experience a real decline in income if its expenditures increase by 15 or 17%.
Wages: necessary catch-up but not free
The revalorisation of public wages responds to an undeniable reality: the monetary collapse had destroyed the real value of wages. A staff member cannot live on a long-term salary whose dollar value has been divided several times.
But the financing of this catch-up counts. If the increases are financed by new revenue, they move from the taxpayer’s purchasing power to the public employee. If financed by monetary creation, they risk reviving cambiar inflation. If financed by debt, they create a future burden.
The choice of VAT and the gas tax therefore reflects a willingness to finance expenditure without returning to monetisation. This is more prudent for the currency, but more directly inflationary in the short term for the consumer.
There is also a second round effect. Public sector increases can become a benchmark for private wage claims. If companies increase wages and then pass the cost on to prices, a wage-price loop may appear. However, the risk remains different from that of an economy in full employment: in Lebanon, weak demand and activity partly limit this mechanism.
Reconstruction: necessary but potentially inflationary in the short term
War also creates reconstruction needs. In the medium term, rebuilding infrastructure and housing increases productive capacity. In the short term, rapid reconstruction can increase demand for cement, steel, labour, transport and equipment in an economy with already limited capacity.
The effect will depend on external financing. A reconstruction financed by foreign donations or capital brings currencies that facilitate the necessary imports. Reconstruction financed mainly by domestic resources would put more pressure on prices and credit.
The World Bank stresses that humanitarian and reconstruction needs will affect public finances in the second half of the year. It will therefore be necessary to monitor not only the level of expenditure but also its composition, funding and timing.
The risk of further pressure on the exchange rate
Current inflation is growing with a stable exchange rate. This stability should not be regarded as definitively achieved. The World Bank warns that declining foreign exchange inflows or prolonged conflict-related shocks could put pressure on parity.
That would be the most dangerous scenario. The cost mechanisms described in this article would then combine again with the cambiar channel. An increase in oil, freight, taxes and banking costs would be amplified by a depreciation of the pound for prices still denominated in local currency.
Maintaining monetary stability is therefore essential, but it is not enough. Lebanon must simultaneously reduce the structural premium that keeps inflation well above that of the dollar.
What would actually lower inflation
The first condition is a lasting reduction of military risk. It would reduce freight, insurance, precautionary stocks and part of the energy premium.
The second is the effective restructuring of the banking system. It is not enough to adopt texts: we must recognize losses, recapitalize viable institutions, resolve those that are not, protect depositors in a coherent hierarchy and restore credit.
The third is an energy policy capable of reducing the dependence on diesel and generators. Each kilowatt hour produced at a more stable cost reduces the sensitivity of the economy to oil.
The fourth is a more predictable fiscal policy. Government revenue needs to be restored, but the accumulation of indirect taxes on fuel, imports and consumption has a higher inflationary cost than that of levies that are better distributed on income, rents and bases now undertaxed.
The fifth is the restoration of competition and transparency. The more competitive markets are, the more firms are forced to absorb some of the shocks rather than pass them on in full.
Finally, Lebanon must restore sufficient detailed economic statistics to measure these mechanisms. Inflation of 17.5% cannot be properly combated if the share of oil, freight, taxes, credit and domestic services cannot be distinguished.
An indicative matrix of contributions
A conservative decomposition can be built around forks. It should not be presented as an official measure but as an analytical scenario.
Underlying international inflation and non-shock-specific imported prices in Lebanon could amount to about 2.5-3.5 points.
Energy and the second-round effects of the oil shock could be about 2.5-4 points.
Freight, insurance, supply disruptions and precaution stocks could amount to about 1.5 to 3 points, with significant overlap with the energy block and conflict.
Domestic repricing in dollars — education, rent, services and wages — could be about 2-3 points.
Banking malfunction, letters of credit, cash immobilization and the cost of capital could amount to about 1-2 points, possibly more in some sectors that are highly dependent on imports.
Taxes, fees and administered prices could contribute around 0.7 to 1.5 points depending on the actual transmission.
The rest are margins, competitive structure, factor interactions and non-isolated categories.
These forks overlap. Their gross sum may exceed 17.5% because the same shock may belong to several causal chains. Oil increases freight; more expensive freight increases the need for financing; more expensive financing increases the cost of the stock; a tax may then apply to this higher price. A true econometric estimate should identify marginal effects and eliminate such double counting.
The central result remains robust: Lebanese inflation cannot be attributed entirely to war.
The cost of non-reform
The war explains the acceleration of 2026. Non-reform explains why this acceleration produces such a high level.
In an economy with a functioning banking system, a company affected by a temporary increase in freight can borrow to smooth the shock. In Lebanon, she immobilizes her cash.
In an economy with a reliable electricity grid, oil increases mainly affect transport. In Lebanon, it also affects private electricity production.
In an economy where the state has normal access to financing, an exceptional expenditure can be spread. In Lebanon, the government must maintain a fragile fiscal balance and make greater use of immediate taxes.
In an economy where bank losses have been recognized and distributed, deposits are deposits and banks lend. In Lebanon, exceptional circulars still organize the gradual restitution of debts, while credit remains deeply weakened.
The 17.5 per cent is therefore partly the price of war and partly the price of six and a half years of delay in resolving the crisis.
Who finally pays?
The question of inflation thus joins that of the distribution of losses.
The depositor pays by the unavailability of his savings and by the implicit discount associated with years of waiting. The taxpayer pays by the new taxes. The consumer pays the costs of financing, energy, freight and taxation incorporated into the prices. The company pays by the lack of credit and the immobilization of its own funds. The employee pays when prices increase faster than his or her remuneration.
The banks saw some of their external liquidity transferred to the BDL well before 2019 and then suffered the collapse of the system that they had helped finance. The BDL has considerable commitments and continues to assume the majority of the disbursements of the circulars. The State bears an unsustainable debt and must restore its revenues.
There is no accounting solution to eliminate this loss. Every strategy is to decide how it will be distributed over time and among actors.
Inflation itself becomes one of these distribution mechanisms. It reduces the real value of income and transfers part of the cost to those who cannot quickly adjust their wages, pensions or prices.
Why the 17.5% figure is finally credible
Taken in isolation, 17.5% appear extraordinary for a dollarized economy. Once the mechanisms are added, the figure becomes understandable.
Lebanon is importing a war-related energy and logistics shock. It does so with a banking system that finances imports poorly. Companies immobilize more cash. The State increases certain levies. Domestic services continue to catch up in dollars. Energy infrastructure amplifies oil. Risks of rupture increase stocks and precautionary margins.
Dollarization removes the main accelerator of 2020-2023, but does not remove any of these factors.
This is why the economy can have a stable exchange rate and very high inflation. The price of the dollar is no longer rising; The price of things in dollars continues to rise.
Lebanon has stabilized its currency, not its economy
The 17.5 per cent of inflation forecast by the World Bank is not only a short-term indicator of war. They are a diagnosis of the economic structure of the country.
The war explains a major part of the acceleration: oil, freight, insurance, disruptions and destruction of capabilities. But it strikes an economy that was already abnormally inflationary despite the stabilization of the exchange rate.
The banking system has still not regained its financing function. External liquidity had begun to contract well before 2019 and financial engineering in 2016 had moved more currencies from banks to the BDL. Circulars 158 and 166 still provide for a gradual return of deposits, with a major contribution from the Central Bank. Public finances must remain strict enough to avoid a new monetization, which pushes the state towards tax revenues that partly affect prices.
At the same time, domestic services rebuild their prices in dollars after the collapse of previous years. Education, housing, restaurants and leisure show that inflation is not only imported.
The Lebanese paradox can therefore be summed up simply: the country has managed to stabilize the currency without having yet normalized the mechanisms that determine prices.
The 6.4% recession makes this even more serious. It is not a booming economy whose demand would raise prices. It is an economy that contracts as its costs increase. It is a stagflation fuelled by war, but amplified by the legacy of an unsolved financial crisis.
The central question in the coming months will therefore not only be whether inflation falls when oil or freight relax. She would know what part of the Lebanese inflation premium remained after the shock.
If inflation remains much higher than that of dollar-based economies once the war premium is reduced, the diagnosis will be difficult to circumvent: the problem will no longer be mainly outside Lebanon. It will be found in its banking system, its trade finance, its energy, its taxation, its market structures and the backlog in the resolution of the crisis since 2019.
The 17.5% would then not only be the price of war. They would also be the price of non-reform.
Methodological note
The category contributions cited in this article are first-order approximations obtained by multiplying the weighting of the item in the CPI by its annual variation. Accurate decomposition would require the basic indices and full aggregation formula of the ACS.
The ranges by economic cause are analytical estimates and not official data. They are used to test the consistency of orders of magnitude. They shall not be added without correction of interactions.
The aggregate calculation of April 2026 shows a net narrow external liquidity of approximately $4.13 billion, or 4.89 per cent of customer deposits in foreign currencies. After an indicative floor of 3%, $1.59 billion remains before the deposits, operational requirements and off-balance sheet commitments. This result is compatible with the exhaustion of the free liquidity of several Alpha banks, but the public data do not allow for bank-by-bank establishment.
The existence of negative net reserves as early as 2015 is no longer an assumption: the adjusted table from the Alvarez & Marsal audit estimates them at -5.5 billion dollars. The sensitivities presented for 2026 remain estimates based on published liquid assets and the processing of bank deposits with BDL.
Sources
World Bank, Lebanon Economic Monitor, Summer 2026, A Conflict-Torn Economy.
World Bank, press release of 21 August 2026 on the Lebanese economy.
Central Statistical Administration of Lebanon, Consumer Price Index, July 2026.
International Monetary Fund, Lebanon 2016 Article IV Consultation, Country Report No. 17/19.
International Monetary Fund, Financial System Stability Assessment for Lebanon, 2017.
Bank of Lebanon, communiqués and texts relating to circulars 158 and 166.
Budget documents and official communications from the Lebanese Government on the fiscal measures and public remuneration of 2026.
Toufic Gaspard, Bank of Lebanon: A Forensic Analysis, American University of Beirut, 2024, table 1 based on the Alvarez & Marsal report.
IMF, Lebanon: Financial System Stability Assessment, Country Report No. 17/21, 2017.
IMF, Lebanon: 2019 Article IV Consultation, Country Report No. 19/312.
Bank of Lebanon, external assets and liabilities of BDL, consolidated balance sheet of commercial banks and documentary credits, April 2026.
Bank of Lebanon, Quarterly Bulletin 2017-Q1, import financing by documentary credits in 2016.
Bank of Lebanon, Intermediate Circular 694, May 2024, foreign currency liabilities subject to the 14 per cent ratio.
Bank of Lebanon, communiqué on circulars 158 and 166, data at the end of March 2026.
BusinessNews, estimates of the 11 to 12 % VAT increase, gas tax and public remuneration financing, February 2026.
Figures: tables and graphs
The tables below complete the analysis. Contributions to CPI are first-order approximations obtained by weighting × annual change; They do not constitute an official causal decomposition.
Table 1 — Key macroeconomic figures
| Indicator | Value | Reading |
| Inflation World Bank 2026 | 17.5% | Average annual forecast |
| Real growth 2026 | -6.4 % | Expected recession |
| Real growth 2025 | 4.2 per cent | Estimated abundance before conflict |
| Impact of conflict on growth | -10.4 points | Deficit in the counterfactual without conflict |
| Inflation July 2026 | 15.69 % | ACS, one year change |
| Inflation June 2026 | 17.25 % | ACS, one year change |
| Inflation May 2026 | 19.04 % | ACS, one year change |
| Budgetary surplus 2025 | 3.9% of GDP | World Bank |
Table 2 — Significant accounting contributions to the July CPI
| Post | Weight CPI | Annual inflation | Approx. |
| Transport | 13.1% | 27.61 % | 3.62 pts |
| Food | 20.0% | 14.49 % | 2.90 pts |
| Domestic energy | 11.8% | 20.76 % | 2.45 pts |
| Education | 6.6 % | 35.72 per cent | 2.36 pts |
| Housing | 13.6% | 8.87 per cent | 1.21 pts |
Table 3 — Circulars 158 and 166: amounts documented
| Indicator | Amount | Share |
| Cumulative payments at end March 2026 | USD 6,109 billion | 100 % |
| Cumulative share BDL | USD 4.183 billion | 68.46 % |
| Cumulative share banks | USD 1.926 billion | 31.54 % |
| Payments March 2026 | USD 240.4 MILLION | 100 % |
| Share of banks in March | USD 28.36 MILLION | 11.80 % |
| BDL share in March | 212.04 M USD | 88.20 % |
| Annual rhythm announced by the BDL | > USD 2.5 billion | 158 + 166 |
| Beneficiaries at the end of March 2026 | 578 770 | of which 266,166 special accounts fully reimbursed |
Table 4 — Historical erosion of banks’ external liquidity
| Date | External liquidity | Developments |
| June 2011 | US$ 18.0 billion | Pic cited by IMF |
| May 2016 | USD 10.4 billion | -42% compared to peak |
| End of August 2016 | < USD 8.5 billion | -53% compared to peak |
Table 5 — Indicative causal breakdown of 17.5%
| Channel | Indicative range | Methodological note |
| International Inflation / Prices Imported Off Shock Lebanon | 2.5–3.5 pts | External base; not mechanically assimilate to the US CPI |
| Energy and second round effects | 2.5–4.0 pts | Hovering with war, freight and transport |
| Freight, insurance, ruptures and inventory | 1.5–3.0 pts | Hovering with energy and war |
| Domestic Repricing in Dollars | 2.0–3.0 pts | Education, rents, services, wages |
| Banking malfunction and cost of capital | 1.0–2.0 pts | LC, cash collateral, working capital; estimate |
| Taxation, royalties, administered prices | 0.7–1.5 pt | VAT, fuel, duties and tariffs |
| Margins, competition, interactions | Residual | Avoid double counting |
Table 6 — Transmission chain of imported goods (illustration)
| Step | Potential effect on cost |
| International Price | Global Inflation / Supplier Variation |
| Maritime transport | Freight and hazard pay |
| Insurance | War pay / regional risk |
| Financing | LC, cash collateral, capitalization of funds |
| Port and customs | Fees, fees and charges |
| Local transport | Fuel, generators, logistics |
| Margin / replacement cost | Risk of stock renewal |
| VAT | Tax applied on an already increased basis |